Power, Aerodynamics, and Equipment
Power, aerodynamics, and equipment are the primary factors determining how fast you can ride on a given course. The simulator provides detailed editors for each of these areas, allowing you to precisely model the effects of different configurations.
The Power Editor
In the power editor, you define the power output (in watts) along the course. Power is specified as a function of distance: at defined distance points, you set the target power, and the simulator interpolates linearly between points.
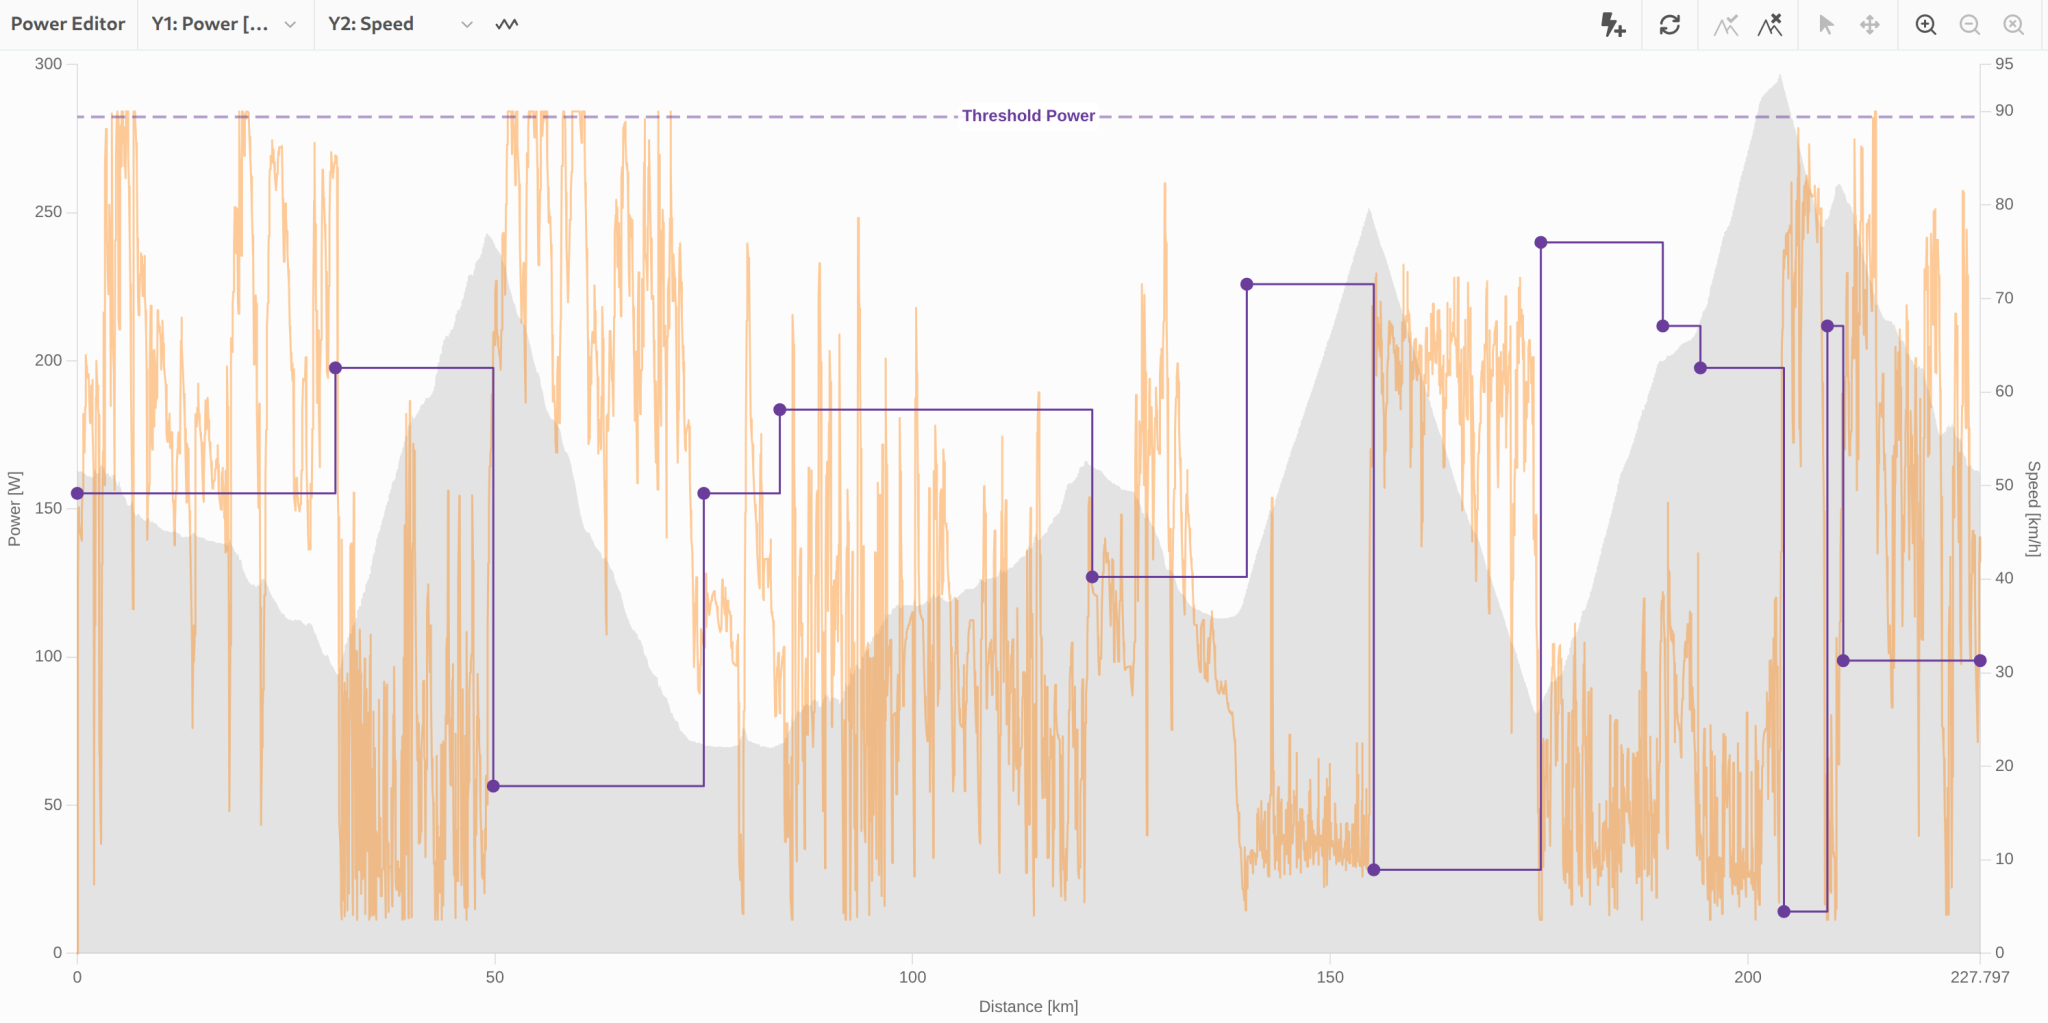
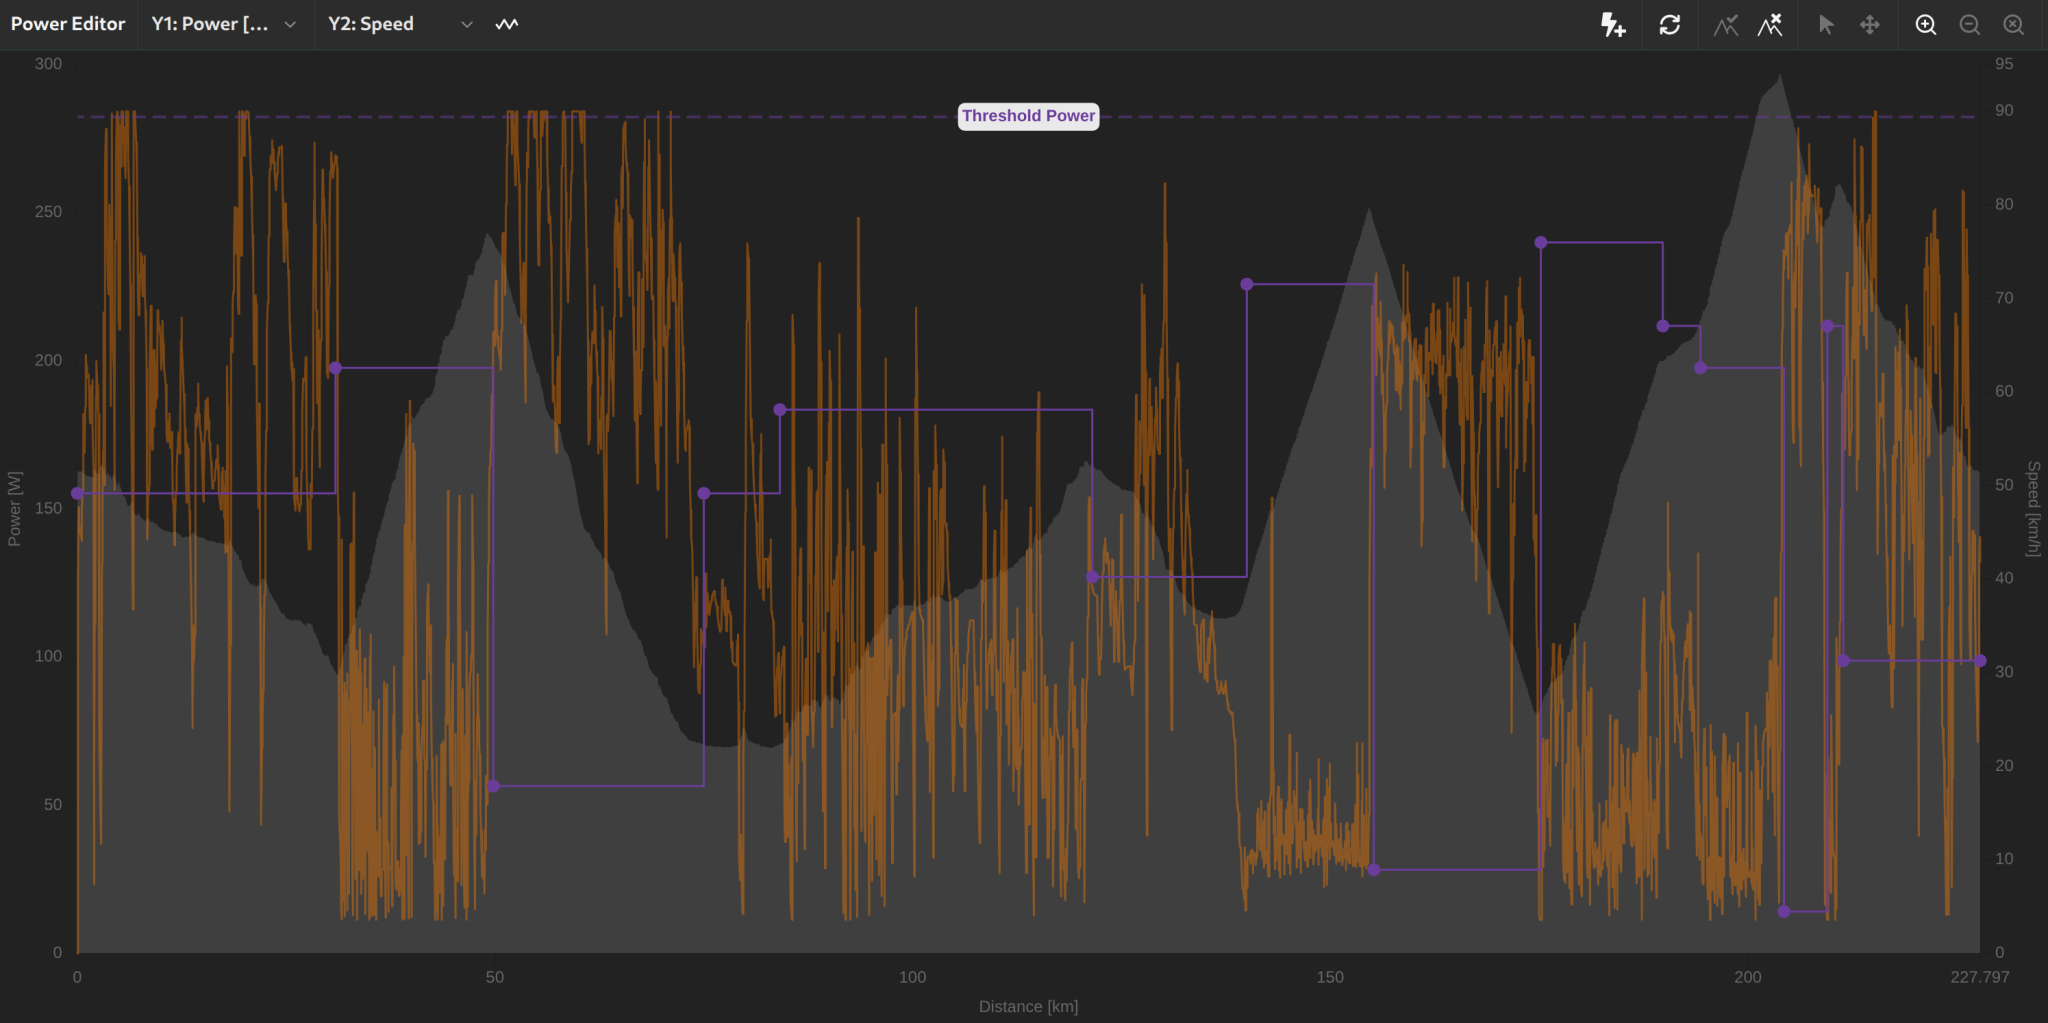
The power editor offers two display modes:
- Chart view: Shows the power profile as a curve over distance, overlaid with the elevation profile. Multiple smoothing levels (None, Low, Medium, High) help with visualization.
- List view: Tabular display of all data points with the ability to edit values directly.
In comparison mode, you can create different power profiles for Scenario A and B to compare their effect on overall time.
Linking Power to Threshold
The Power Specifications Linked to Threshold setting (Settings sidebar tab) controls whether power is held as an absolute value in watts or relative to your threshold power. With the link active, the power editor's primary axis can be switched between watts and % threshold, and the edit dialogs accept the value either as an absolute figure or as a percentage of threshold. A separate % Threshold Grid applies to the percentage view.
This is most useful when your threshold power changes, or when comparing two scenarios with different physiology: a profile defined in % of threshold keeps its intensity structure regardless of the underlying threshold.
Power Overview PDF
The planned power profile can be downloaded as a PDF via Project ▸ Export ▸ Power Overview (.pdf), the counterpart to the nutrition overview. In comparison mode you choose which scenario to export beforehand.
Power Optimization
Instead of setting the power profile by hand, you can have the simulator compute one. Optimize Power is available from the power editor menu and under Project ▸ Import ▸ Optimize Power; in comparison mode you first pick the target scenario. The optimizer searches for a pacing strategy that minimises ride time under the constraints you set.
You define the following inputs:
- Target Average Power: The time-weighted average power the optimised strategy should hold.
- Max Number of Sections: Upper bound on the number of pacing sections. The optimizer produces fewer if adjacent sections would carry similar power anyway.
- Min Section Length: Sections shorter than this are not allowed. Small values capture short, steep features but produce more sections.
- Max Power Cap: No section exceeds this power output.
- Power Variation Limit (Std. Dev.): Caps the time-weighted standard deviation of power around the target. Low values give even pacing; high values allow a more aggressive profile with more power on climbs and less on descents.
The result is shown as a preview first — average power, power variation, normalized power, variability index, power range, and the list of sections with their distance range and target power. Only when you apply it does it replace your existing power profile; otherwise you return to the inputs and recompute with different constraints.
When setting the constraints, keep in mind that the strategy has to be rideable: a large number of very short sections, or differences of a couple of watts, are hard to hit in a race.
The Aerodynamics (CdA) Editor
Drag area (CdA) is, alongside power, the most important factor for speed on flat and gently rolling courses. In the aero editor, you define CdA values at specific distance points.
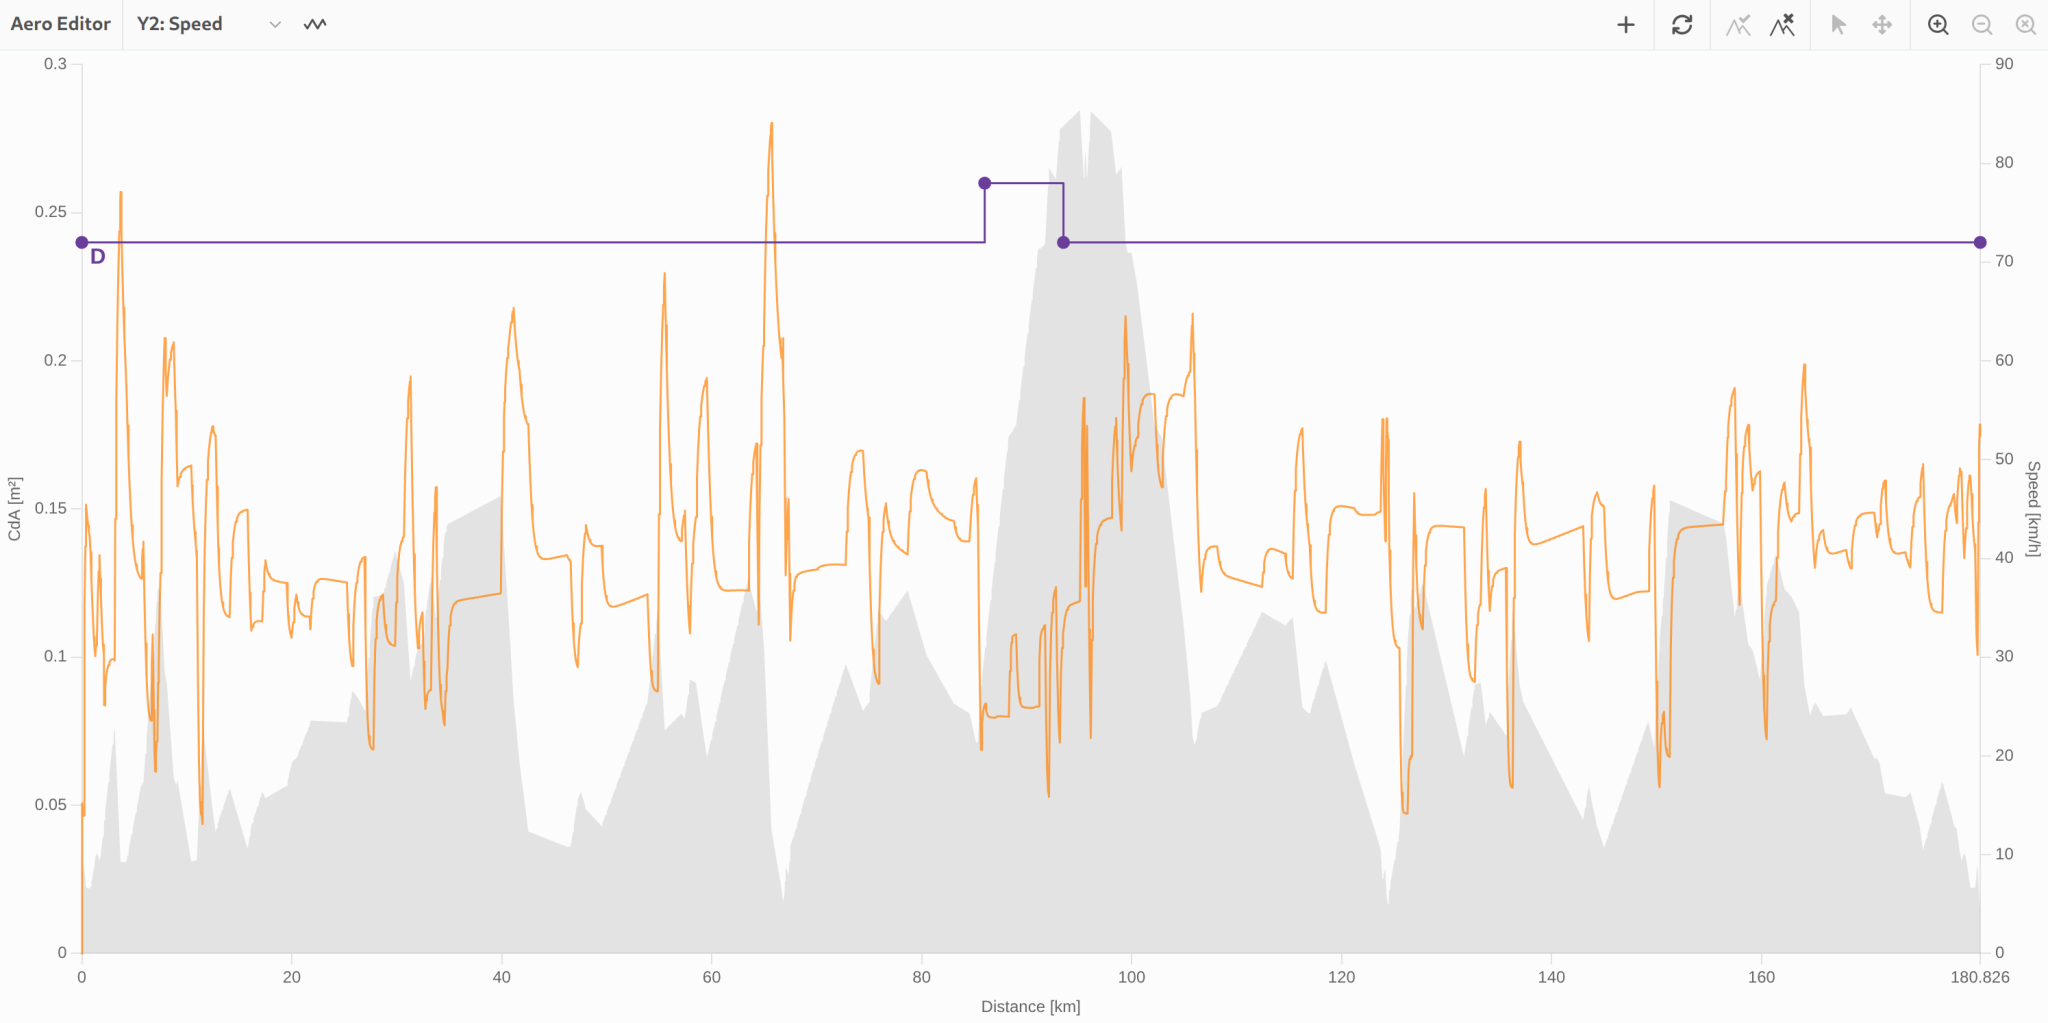
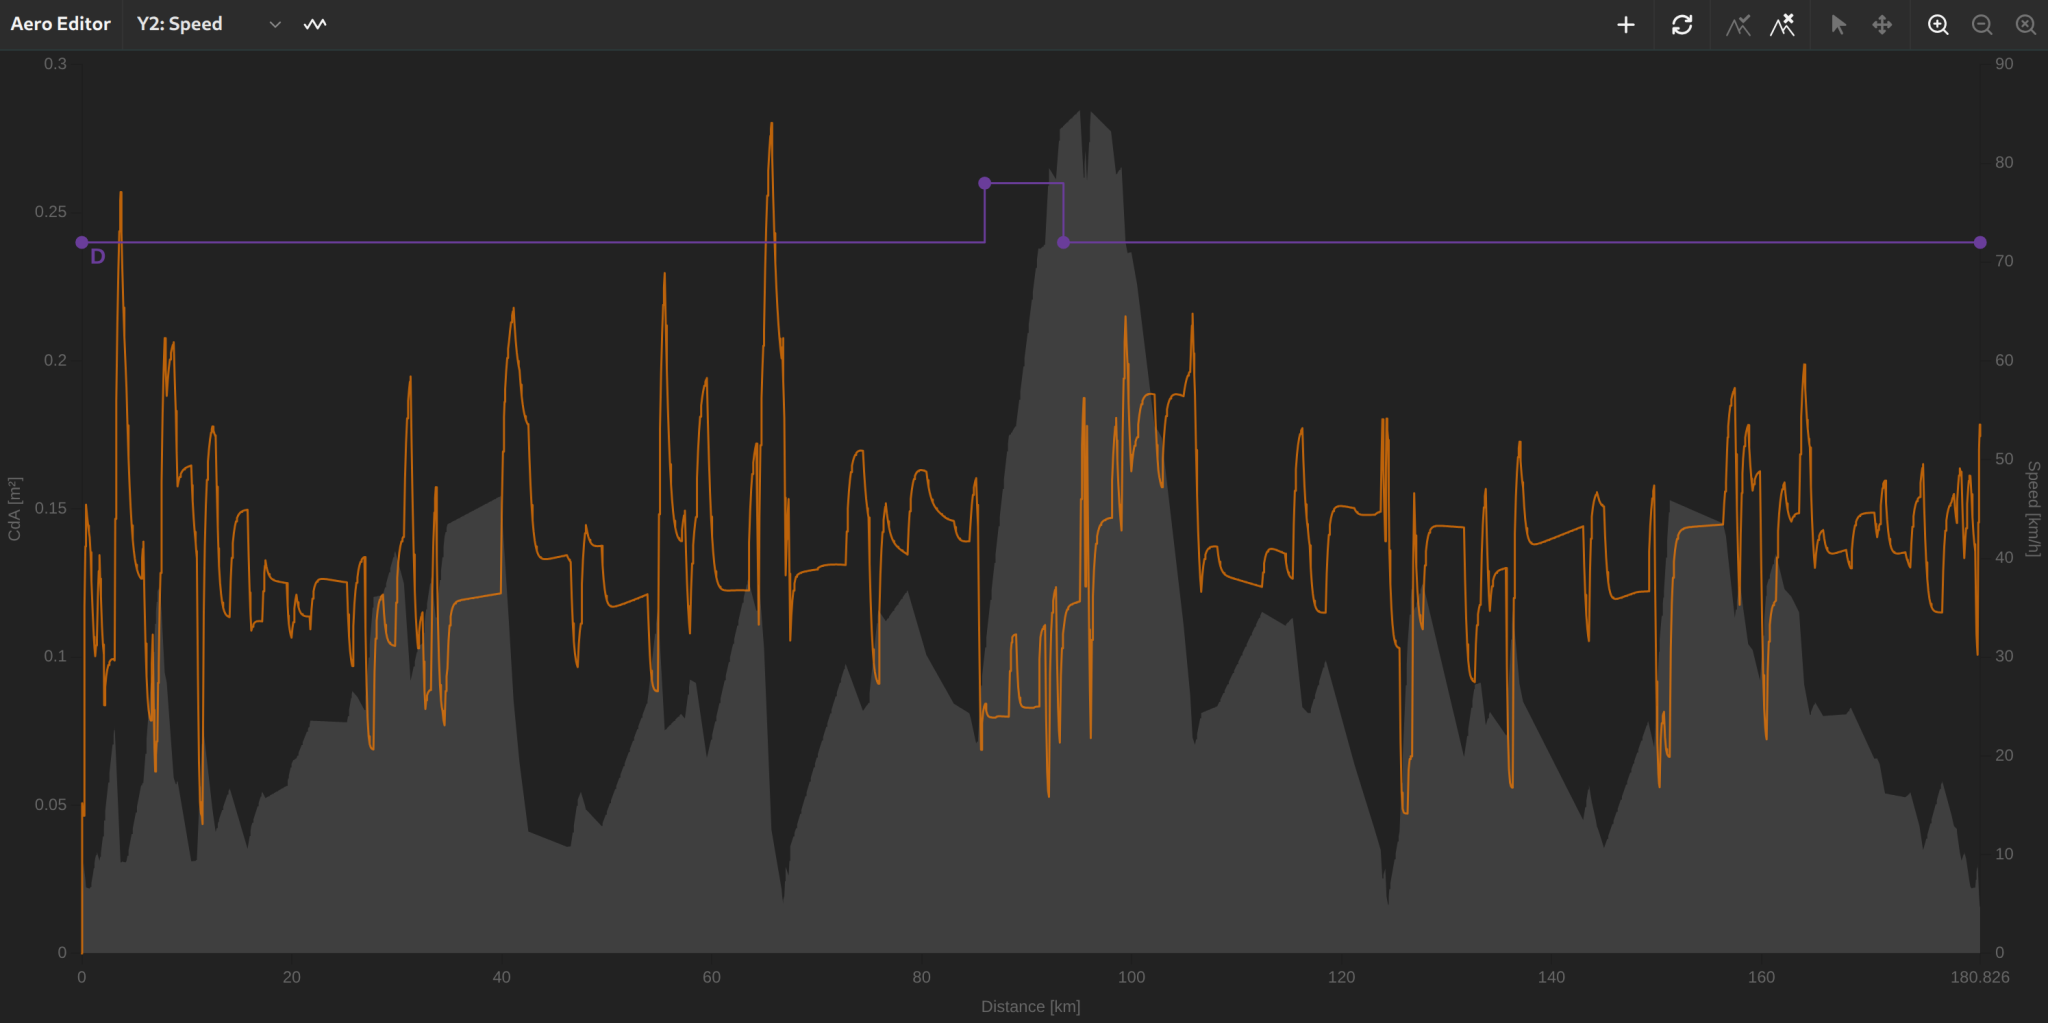
The simulator can automatically estimate CdA based on:
- Bike type: Road, Time Trial (TT), or Triathlon.
- Gear level: Entry-Level, Mid-Range, Premium, or Cutting-Edge.
- Rider dimensions: Height and weight.
The editor accepts CdA values between 0.1 and 0.8 m²; typical cyclist values sit between approximately 0.22 m² (TT position with skinsuit) and 0.40 m² (upright road position with loose clothing).
Drafting and Group Riding
The simulator models three drafting modes that can be configured individually per course segment:
Solo
No drafting benefit – full aerodynamic load. Suitable for time trials and solo training.
Behind a Rider
Based on the model by Blocken et al. (2013), the simulator calculates the velocity deficit in the wake of a leading rider. The effect decays exponentially with increasing distance. You can set the gap to the rider ahead from 0.5 m to 25 m.
Group / Peloton
For riding in a peloton, the simulator uses the model by Gaul and Thomson (2018). You select your position in the group (position 1 = at the front, up to position 50 = deep in the pack). The further back in the group, the greater the drafting benefit.
In the CdA editor, each datapoint shows a small letter next to its marker to indicate its drafting mode at a glance: G for Group / Peloton and D for Behind a Rider. Solo points carry no letter, so the absence of an indicator means full aerodynamic load. The exact peloton position or drafting distance remains accessible by clicking the datapoint to open the edit dialog.
Activity Setup
The activity settings cover boundary conditions of the ride that don't stem from power, aerodynamics, or equipment, but from how the rider behaves on the course. They live in the Activity tab of the sidebar:
- Initial speed: The speed at the start of the activity. Mainly affects the acceleration phase after a standing start or rolling out of a descent.
- Maximum lean angle: The maximum angle at which the rider can lean into a corner. Only applied to imported courses with coordinates, where it caps cornering speed. Typical road-cycling values sit between 30° and 40°; experienced riders reach up to about 45° on good tarmac.
- Maximum allowed speed: Upper bound on speed throughout the simulation – useful for keeping descent speeds realistic.
- Maximum braking deceleration: The maximum deceleration achievable through braking. Together with the lean angle, this constrains the approach speed into curves on imported courses.
Maximum lean angle and maximum braking deceleration only appear once you reveal the advanced options in the sidebar. Maximum allowed speed is always visible.
Equipment Setup
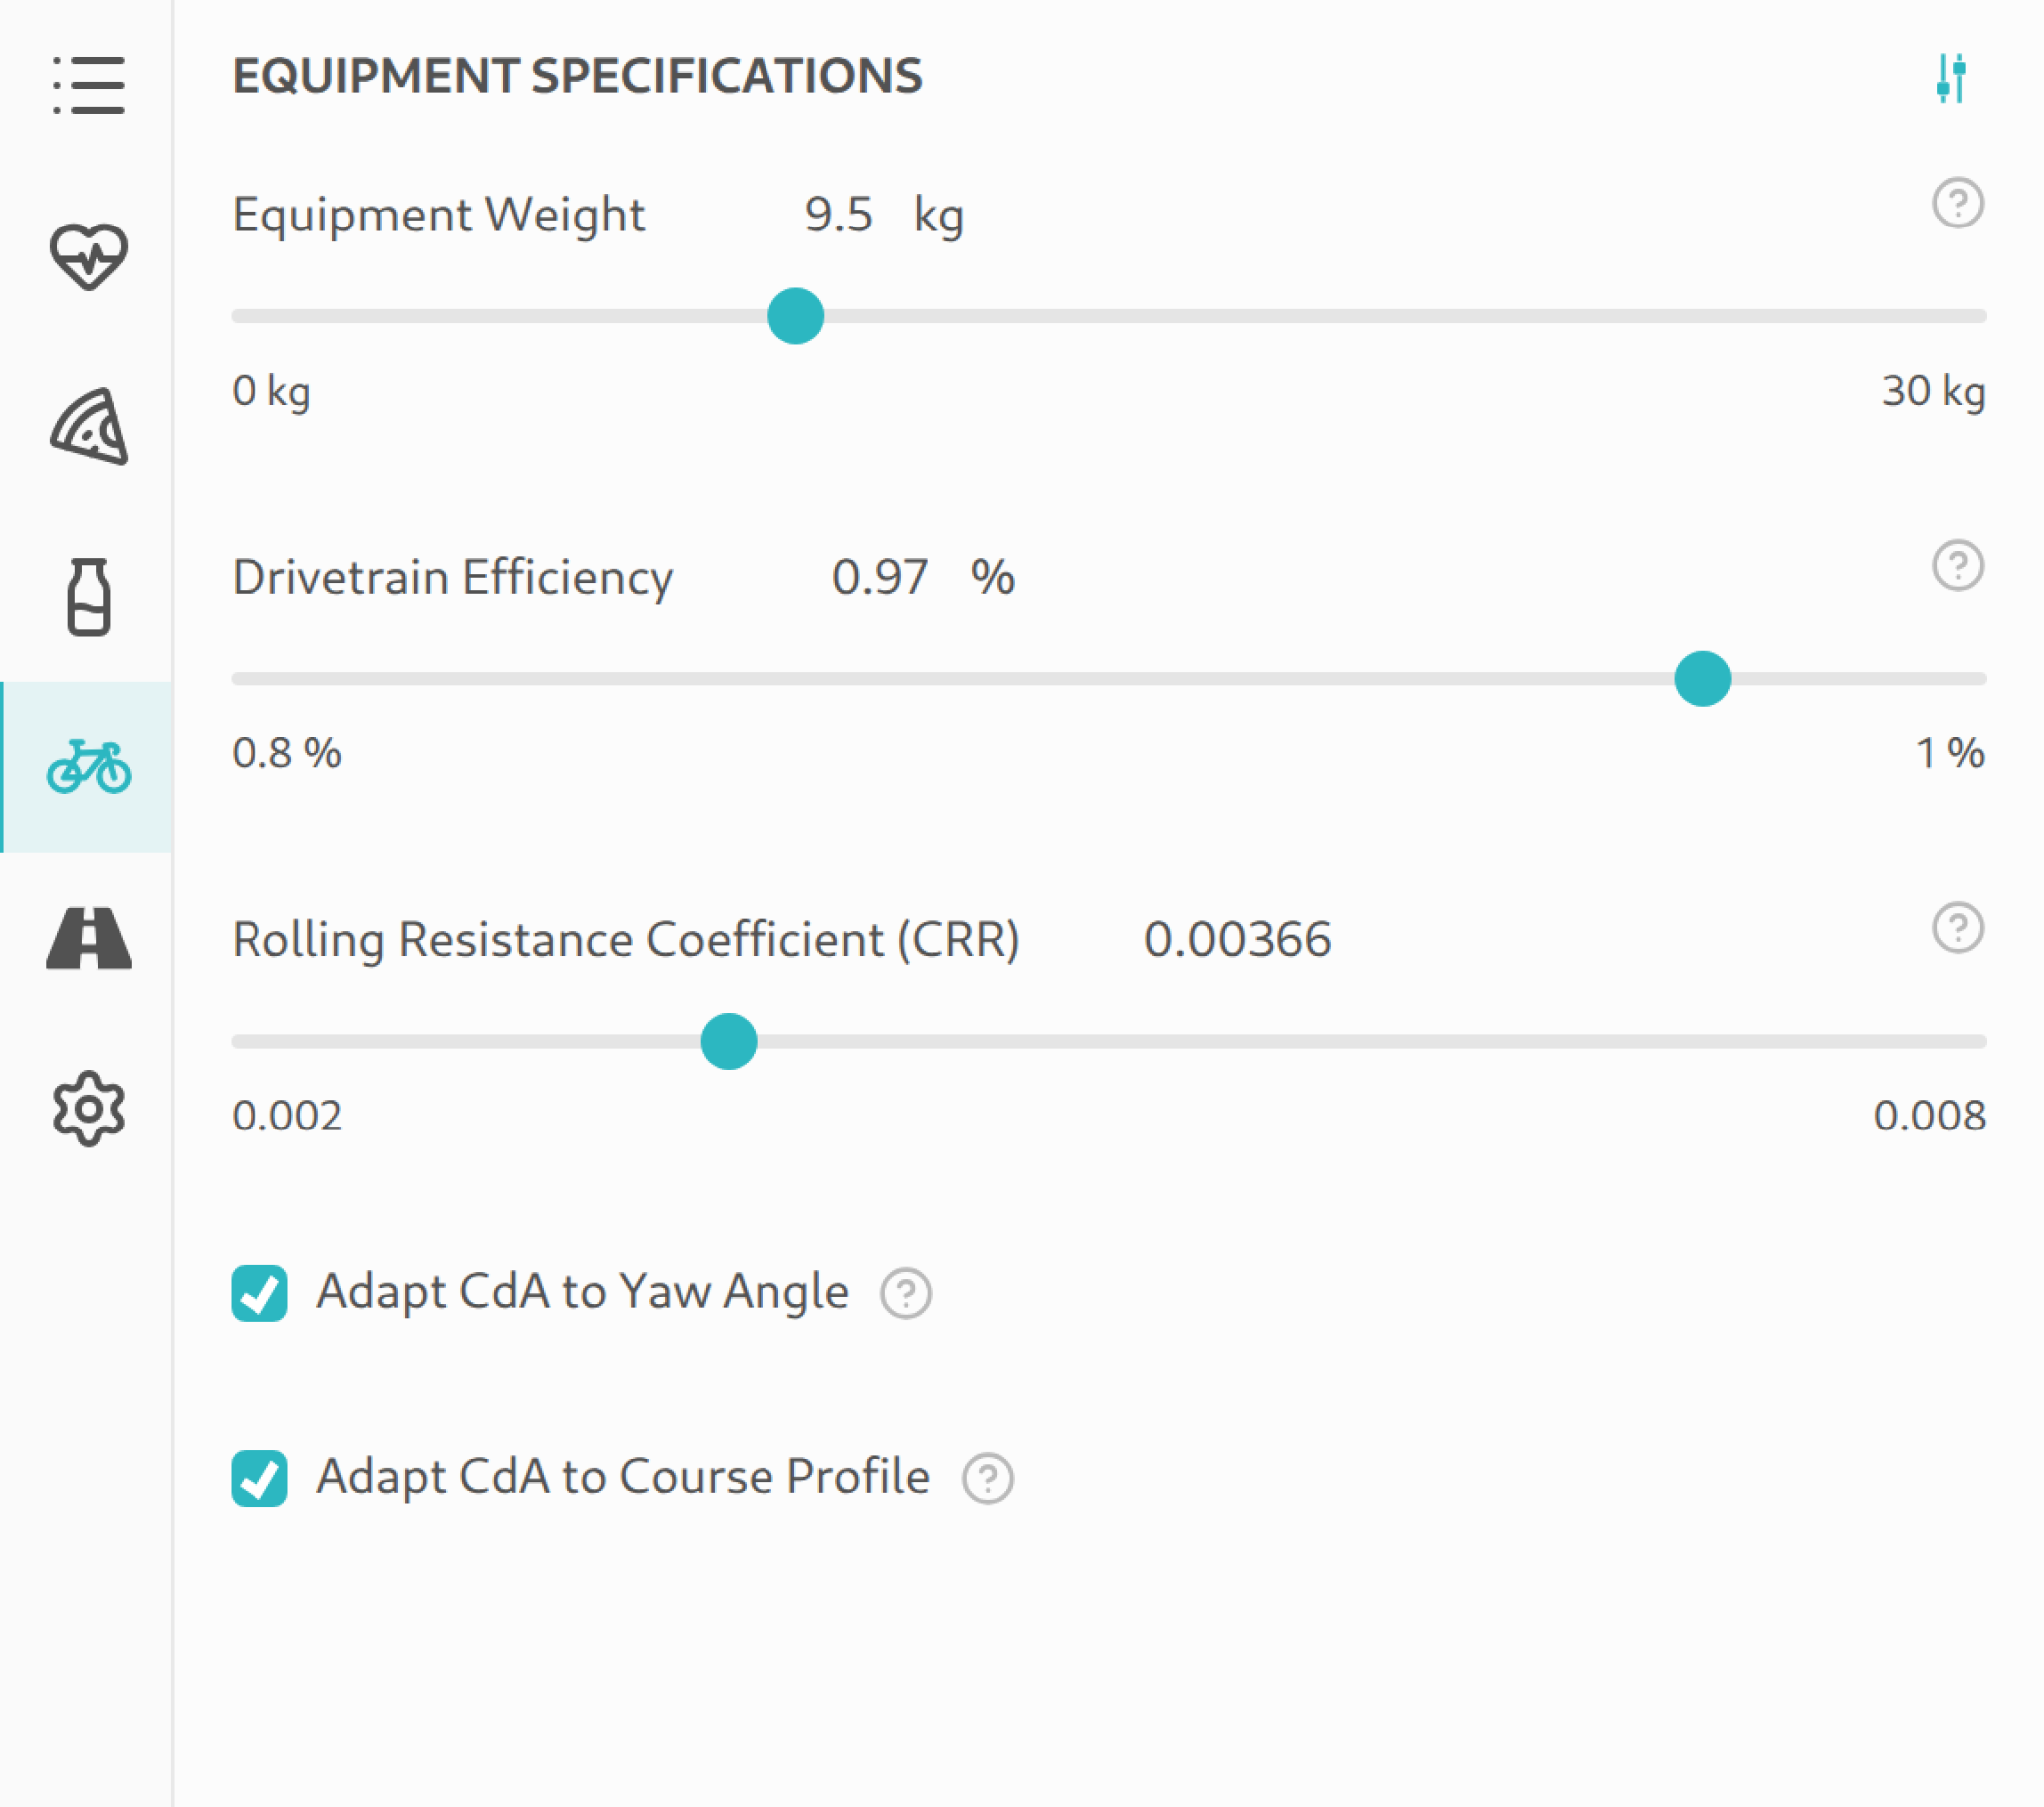
The equipment configuration covers all physical properties of your bike and gear that feed into the simulation:
- Equipment weight: Total weight of the equipment (bike including accessories). Affects climbing and acceleration resistance.
- Drivetrain efficiency: 80–100%, with modern well-maintained road drivetrains at the upper end of this range. Describes mechanical losses in the drivetrain.
- Rolling resistance coefficient (CRR): 0.002–0.008, with high-end race tires on clean dry tarmac at the lower end of this range. Depends on tires, tire pressure, and surface.
- Adapt CdA to yaw angle: Adjusts the CdA based on the yaw angle between the rider and the apparent wind, modelling the increase in aerodynamic drag in crosswinds.
- Adapt CdA to course profile: Increases the CdA on steep and slow sections to simulate the rider sitting up (smooth adjustment based on gradient and speed).
Drivetrain efficiency, rolling resistance, and the two CdA adaptation toggles only appear once you reveal the advanced options in the sidebar.
Equipment Estimator
The equipment estimator automatically calculates typical values for bike weight, CdA, and rolling resistance based on your selected bike type, gear level, and body dimensions. This provides a solid starting point that you can refine afterwards.
Equipment Comparison with A/B Mode
Comparison mode is ideal for equipment decisions. Create two scenarios and change one parameter at a time:
- Road bike vs. time trial bike – how much time do you save with the more aerodynamic position?
- Lightweight climbing wheels vs. aero wheels – which setup is faster on your course?
- Different riding positions – how does a 0.02 m² lower CdA affect overall time?
The metrics pane shows the direct time difference and average speed deltas.