Knowledge Base > Features and Functions
Energy Consumption
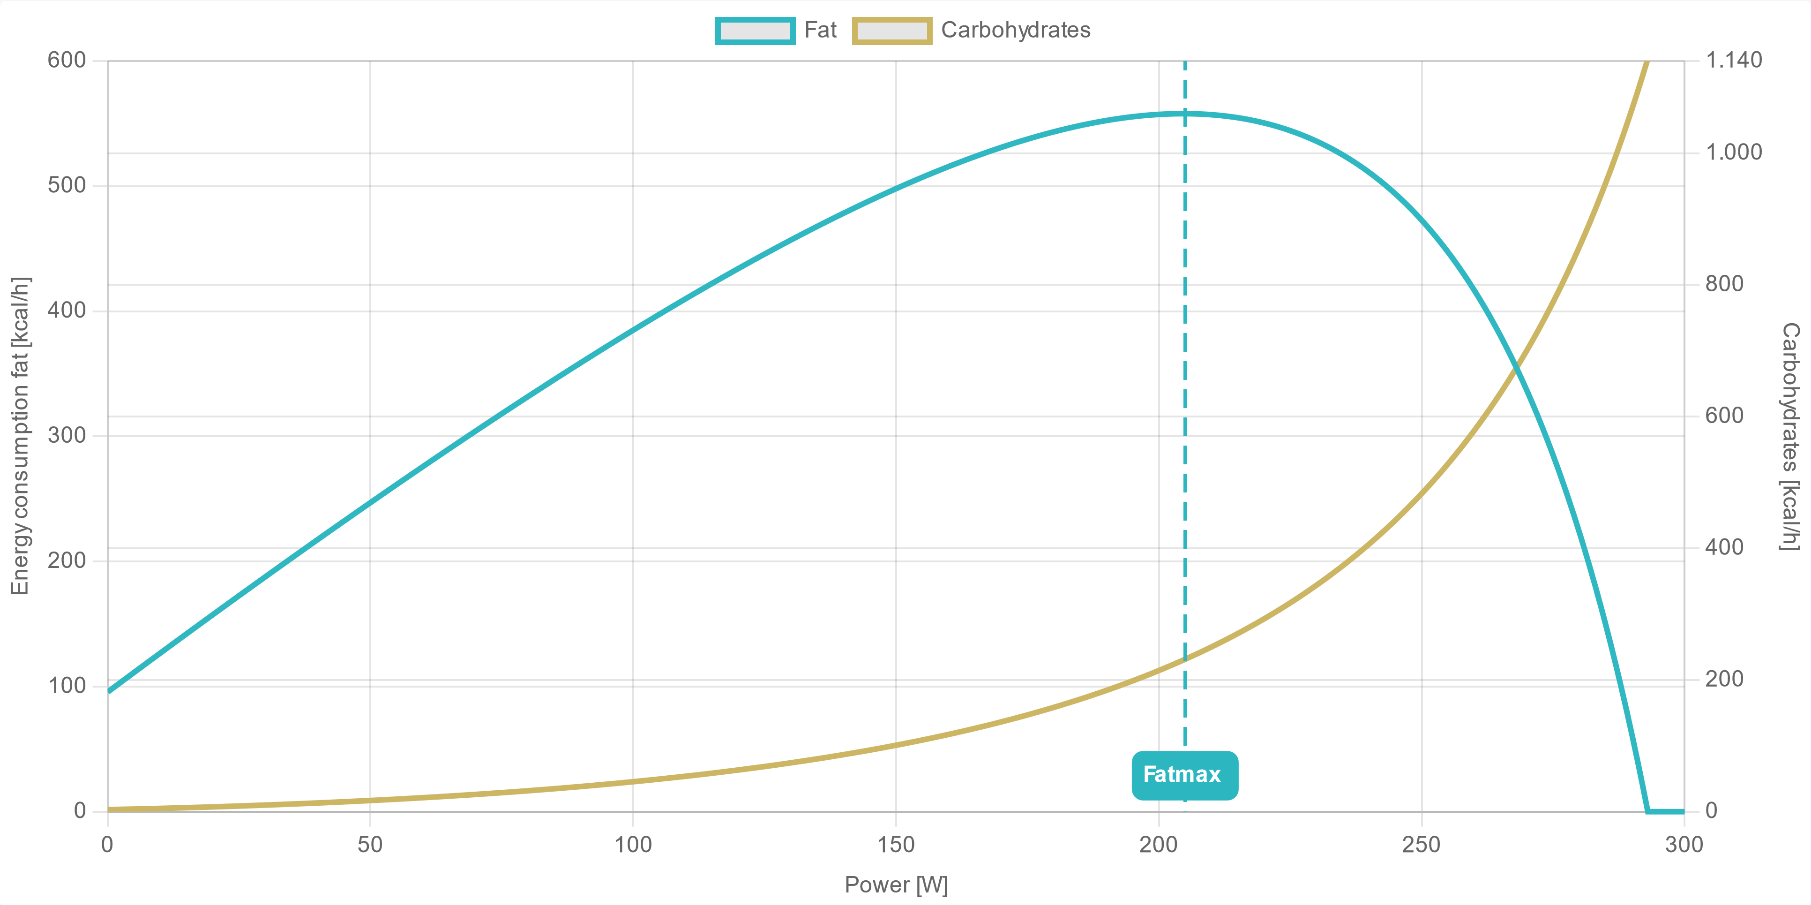
Energy diagram of an exemplary AI DIAGNOSTICS performance report
The Energy Consumption chart shows the carbohydrate and fat metabolism. It can be used to determine carbohydrate consumption in training or competition.
The energy consumption from fat is shown in kcal/h. Fatmax describes the power at the absolute highest fat metabolism rate. At your anaerobic threshold or above, hardly any fat metabolism takes place anymore. Carbohydrate consumption is shown in kcal/h and g/h and increases exponentially with power output ($E_{\text{carb}}(P) \sim e^{\,k\,P}$, with $k$ an athlete-specific shape parameter); the shape of the curve depends on your anaerobic capacity (VLamax).
Detailed values for a specific power can be displayed using the mouse-over function.