Nutrition and Hydration Planning
The right nutrition and hydration strategy can make or break a race. The Ride Simulator lets you plan and optimize your nutrition and fluid intake in advance – based on your individual energy demands, course conditions, and physiological data.
Why Nutrition Planning Matters
During intense endurance efforts, glycogen stores in muscles and liver are the primary source of carbohydrate energy. When these are depleted, you "bonk" – a drastic drop in performance. Proactive carbohydrate intake planning helps you avoid this critical point.
Adequate fluid intake is equally important to prevent dehydration. However, excessive fluid without sufficient sodium can lead to hyponatremia. The simulator models all of these factors so you can develop a balanced strategy.
For background on the underlying physiology, see Glycogen Stores and Carb Loading.
The Nutrition Editor
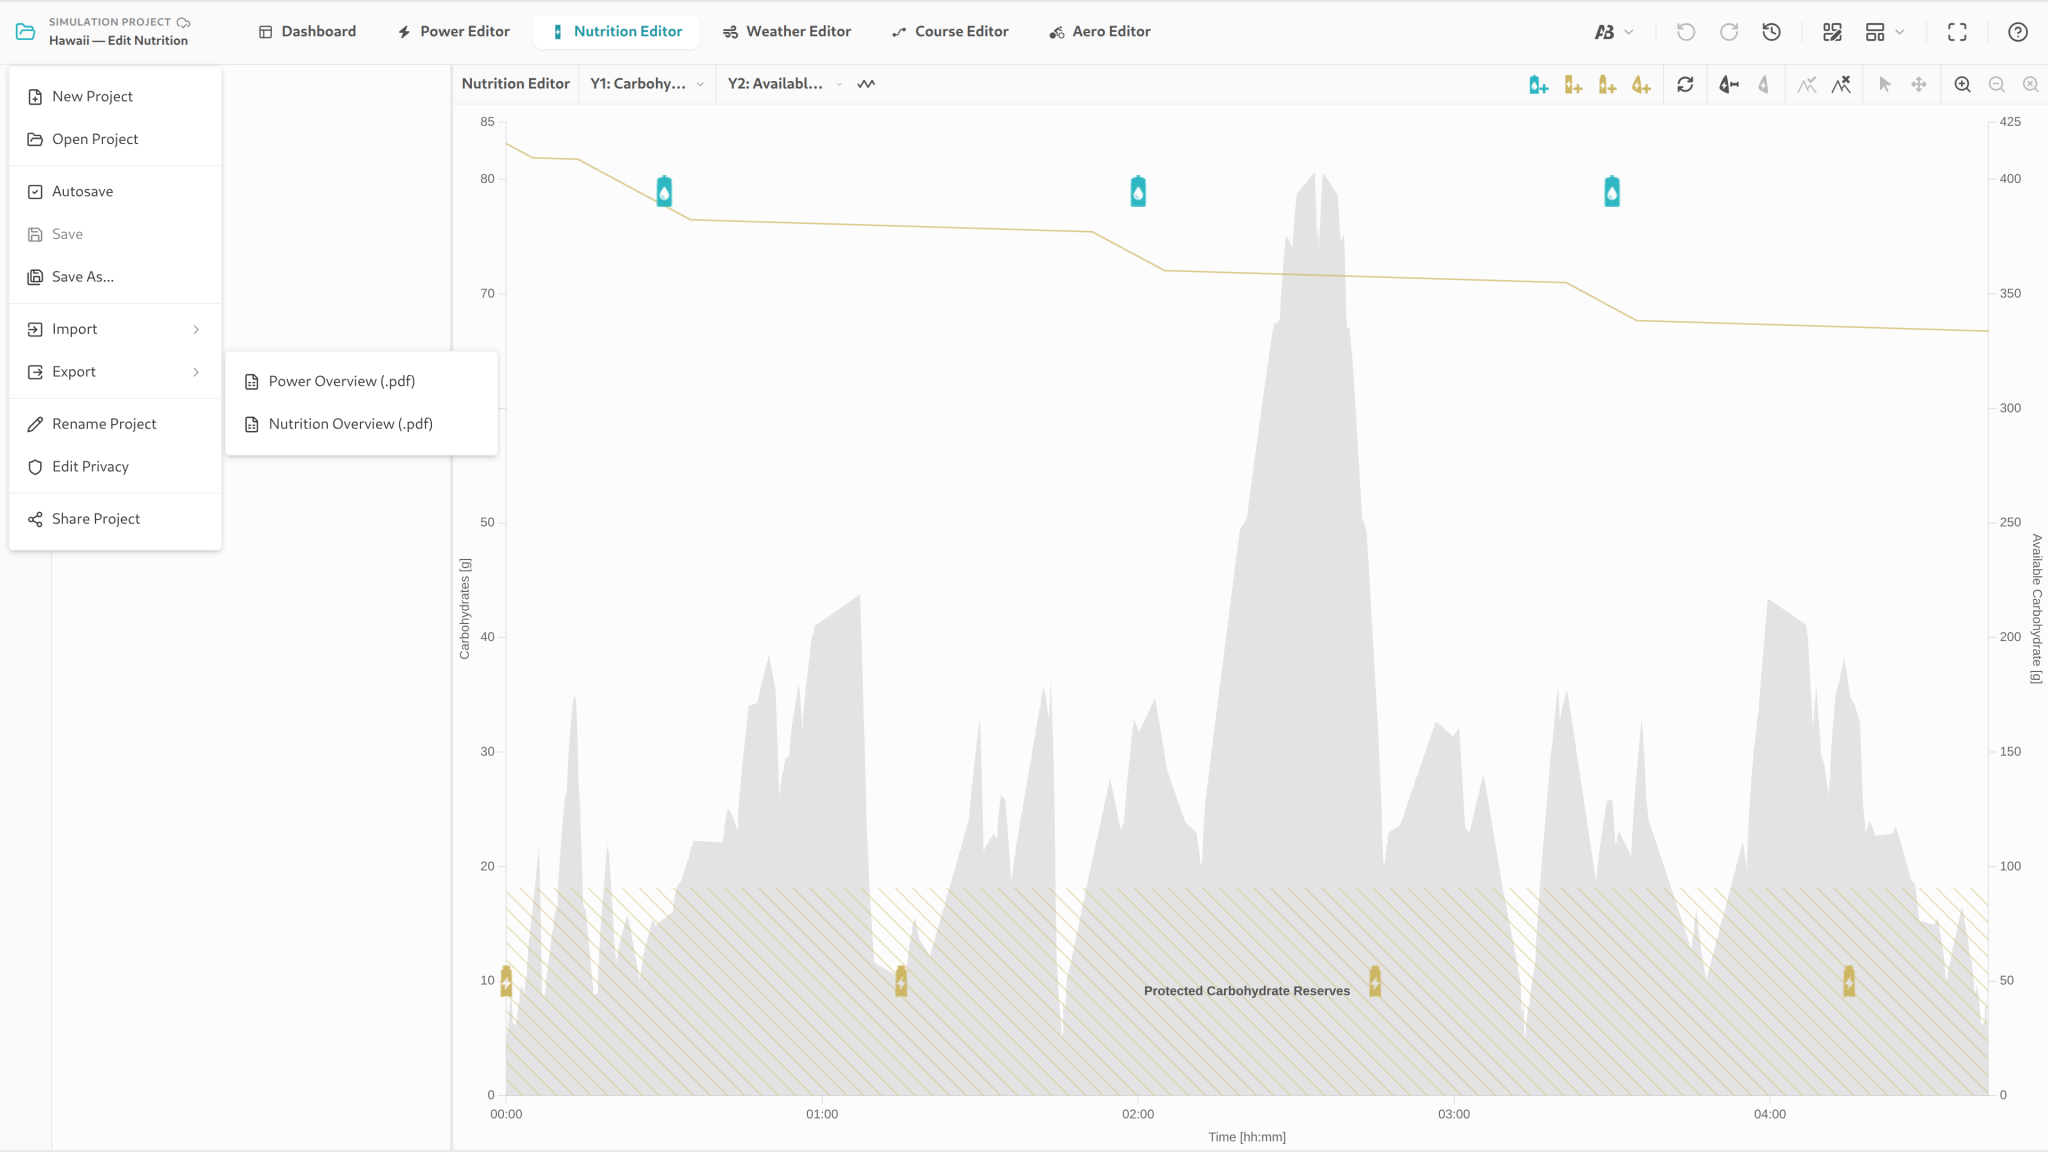
In the nutrition editor, you plan the intake of drinks, gels, bars, and other food items along the time or distance axis. For each intake, you define:
- Product: Select from the database of real sports nutrition products.
- Timing: When the product is consumed.
- Delay: The individual absorption delay before the product is processed by the gastrointestinal tract.
- Duration: Over what time period the product is consumed (e.g., a drink over several minutes).
Whether delay and duration are actually editable depends on the settings: by default only the uptake duration of drinks can be changed. The Settings sidebar tab carries a separate switch for uptake duration and uptake delay — one pair for drinks and one for other nutrition products.
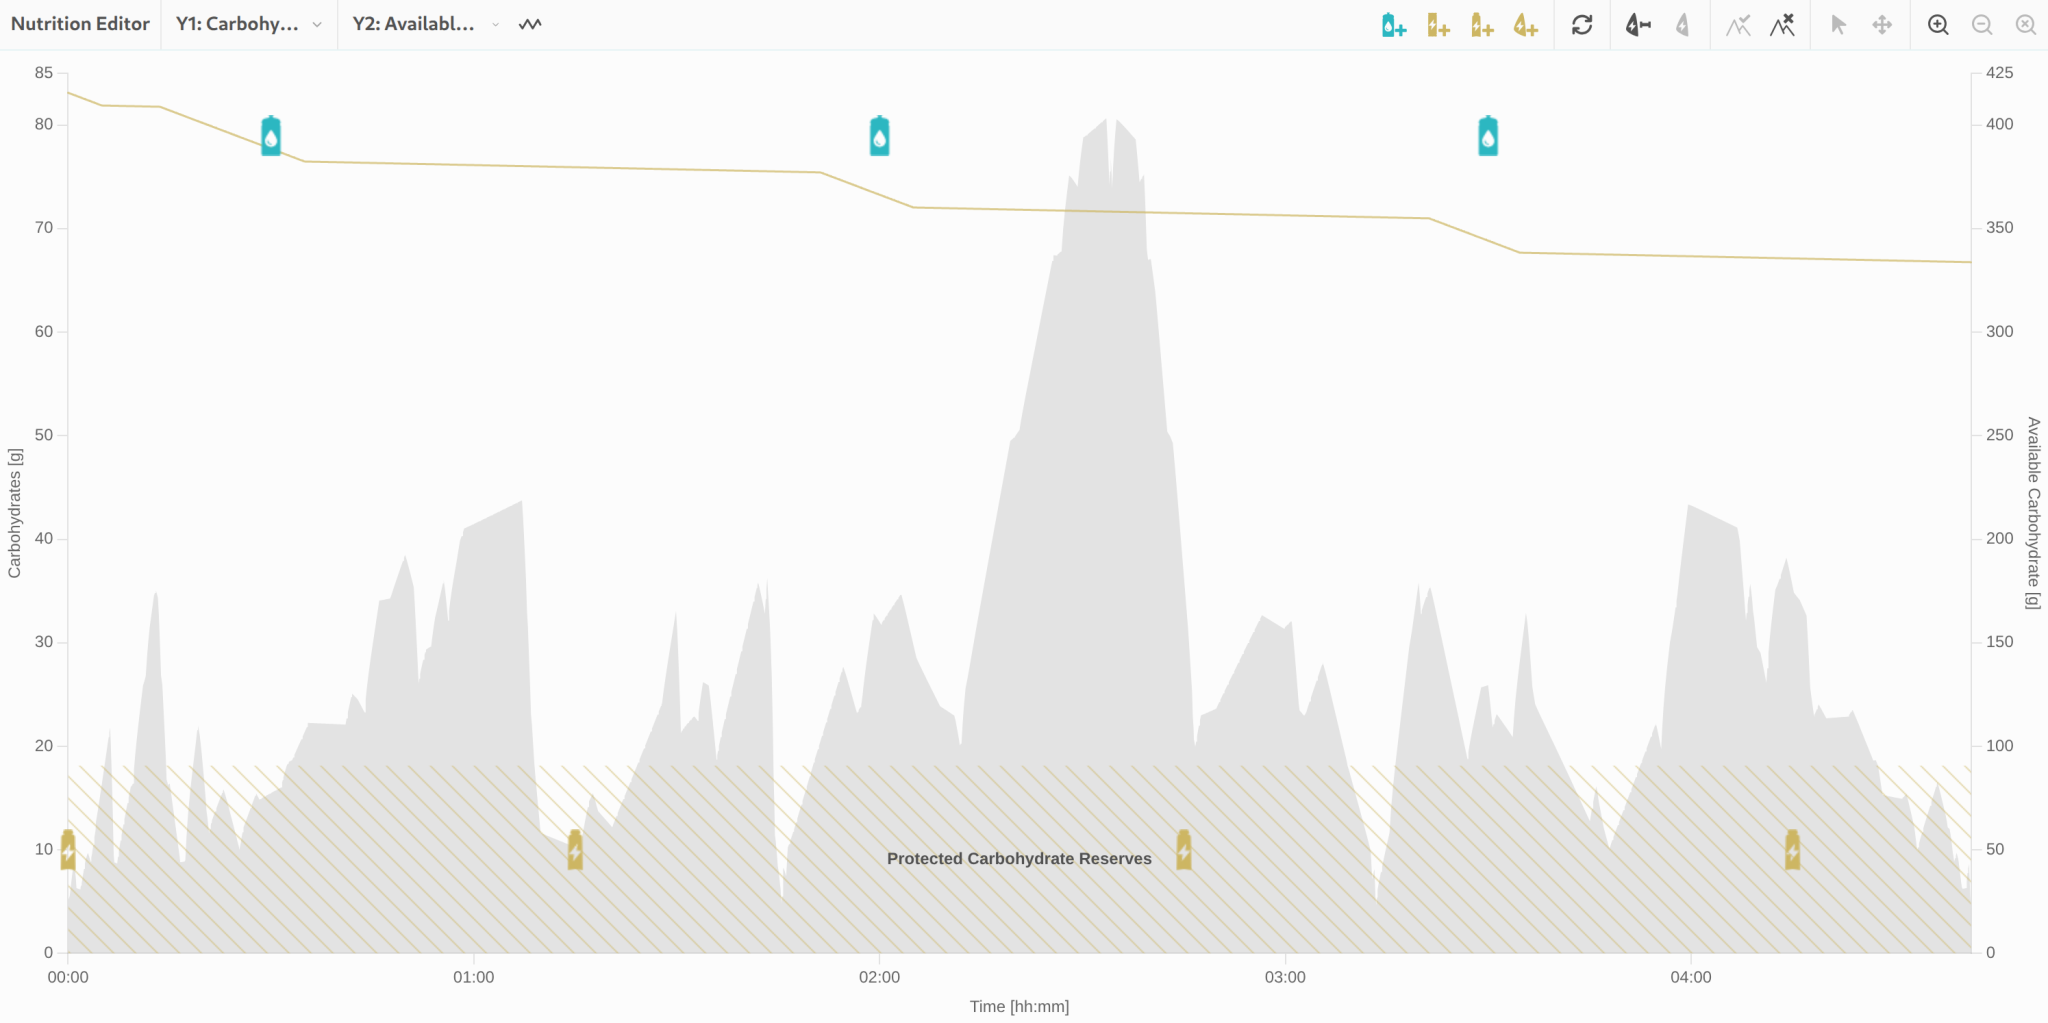
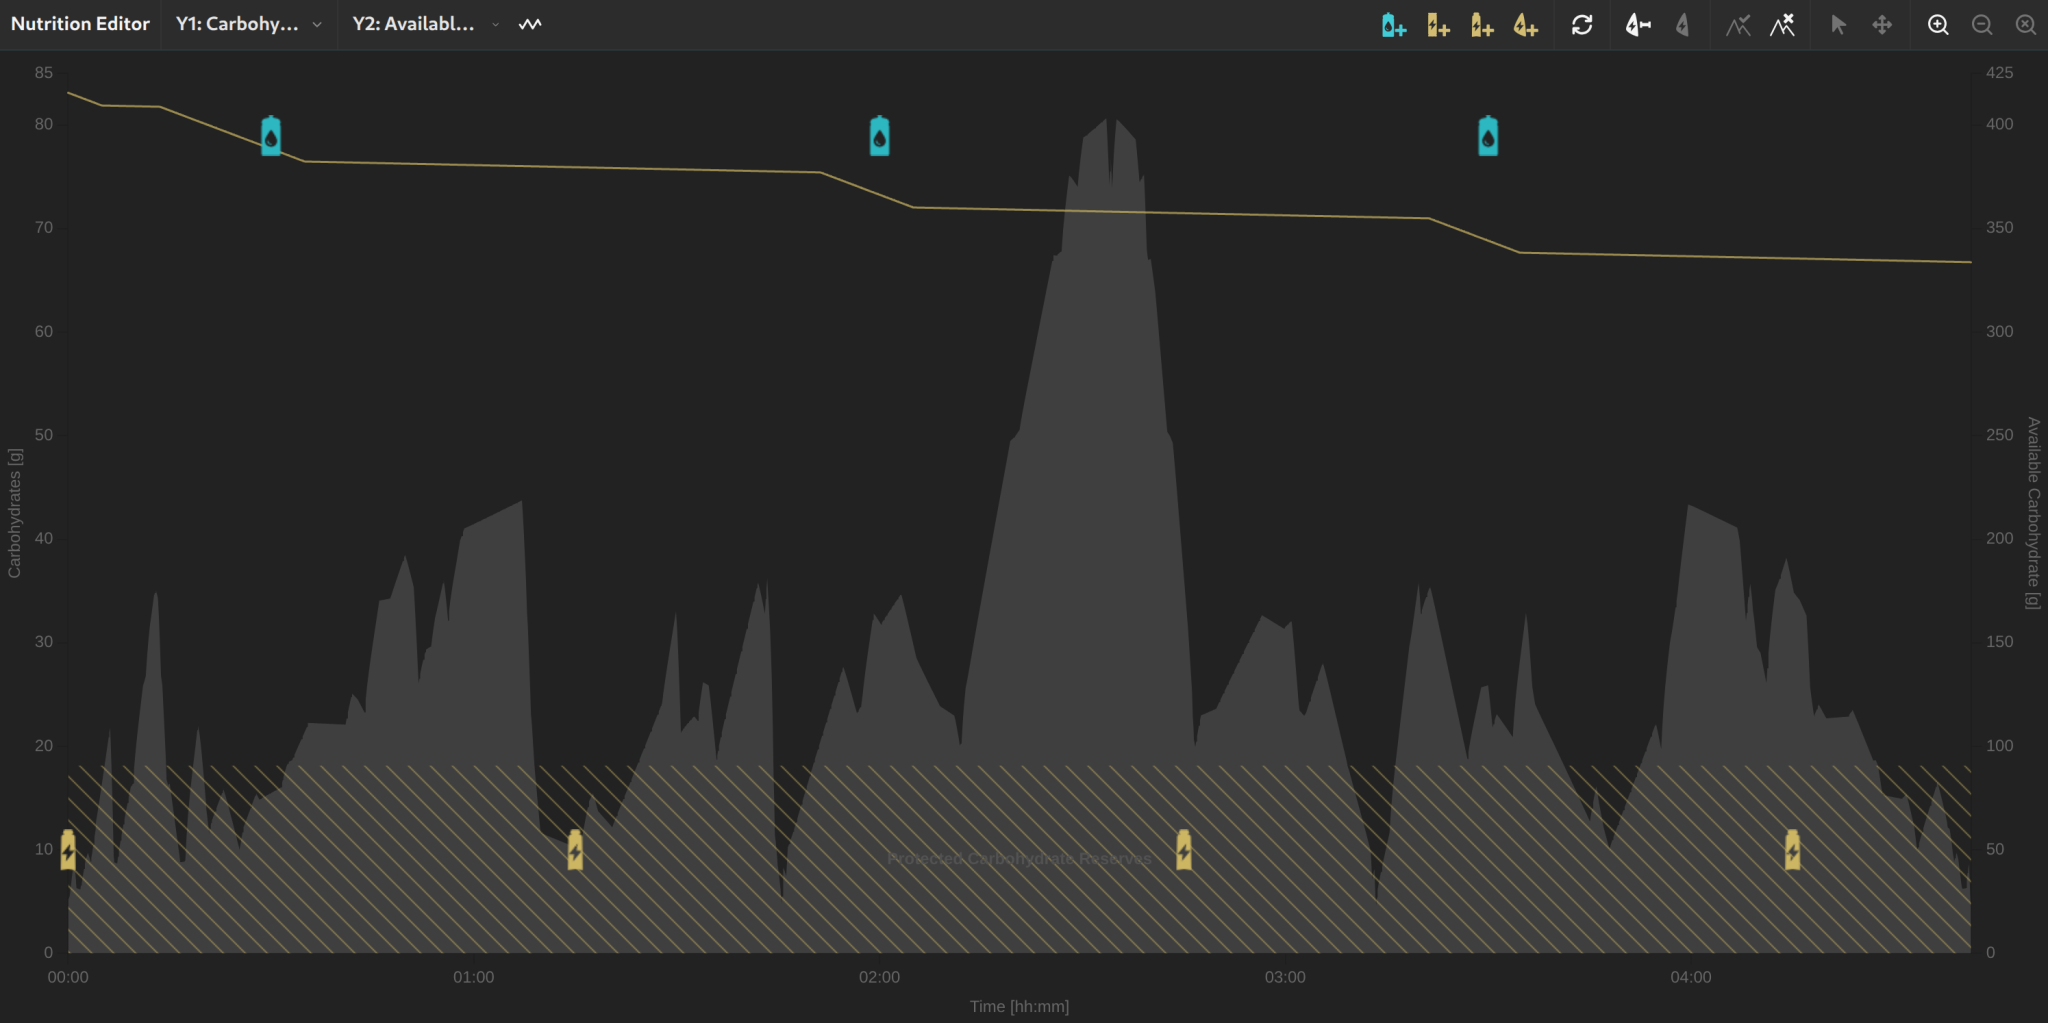
The time grid for nutrition planning is adjustable: 1, 2, 5, 10, or 15 minutes.
Sports Nutrition Product Database
The simulator includes an extensive database of real sports nutrition products. Each product comes with detailed nutritional information:
- Carbohydrates (g)
- Fat (g)
- Protein (g)
- Sodium (mg)
- Caffeine (mg)
- Water content (ml)
- Total weight (g)
Available brands include:
- Maurten
- SIS (Science in Sport)
- CLIF Bar
- PowerBar
- Mnstry of Nutrition
- High 5
- Winforce
- Dextro Energy
- KORO
- Basic – generic standard drinks, gels, and bars
You can filter which brands appear in the product selection through the settings.
Carbohydrate Demand and Intake
The simulator calculates carbohydrate demand based on your power output and physiological data. This demand describes how many grams of carbohydrates per hour your body consumes at the given intensity.
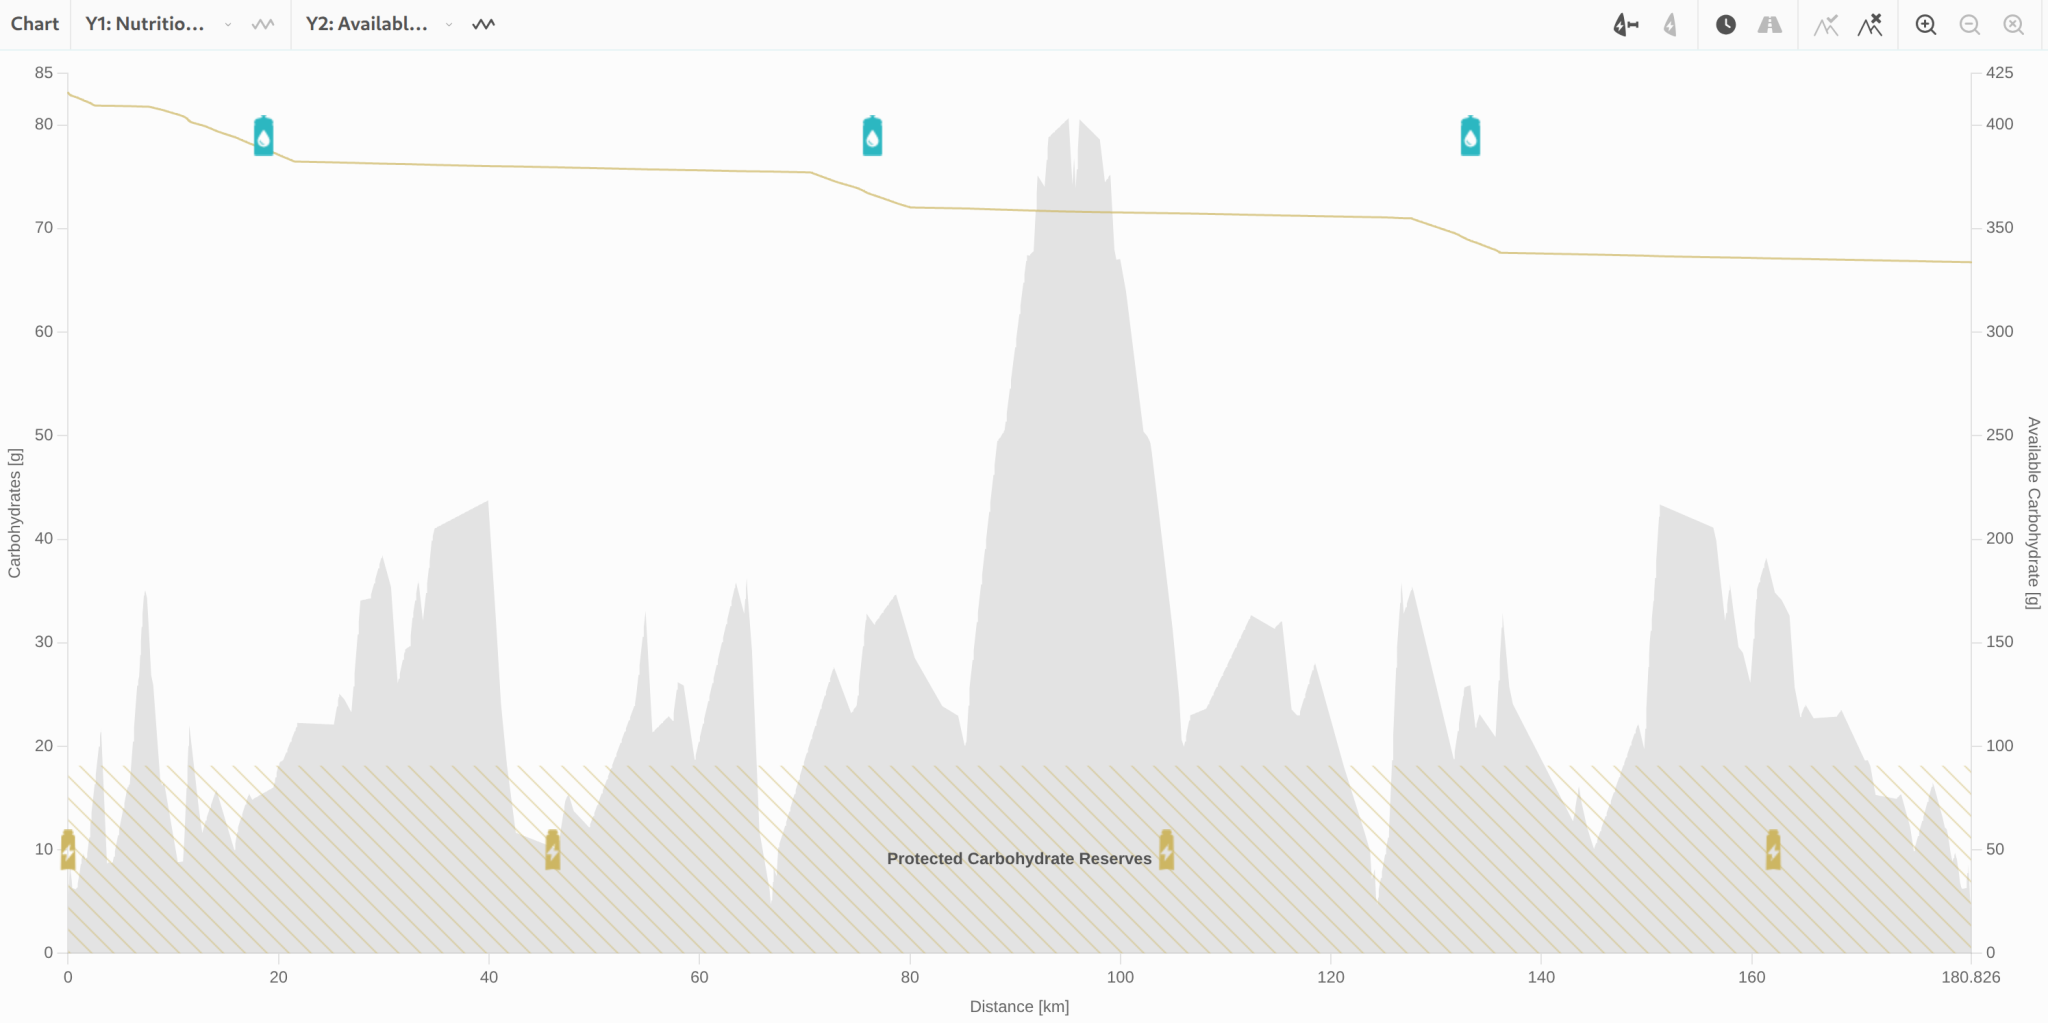
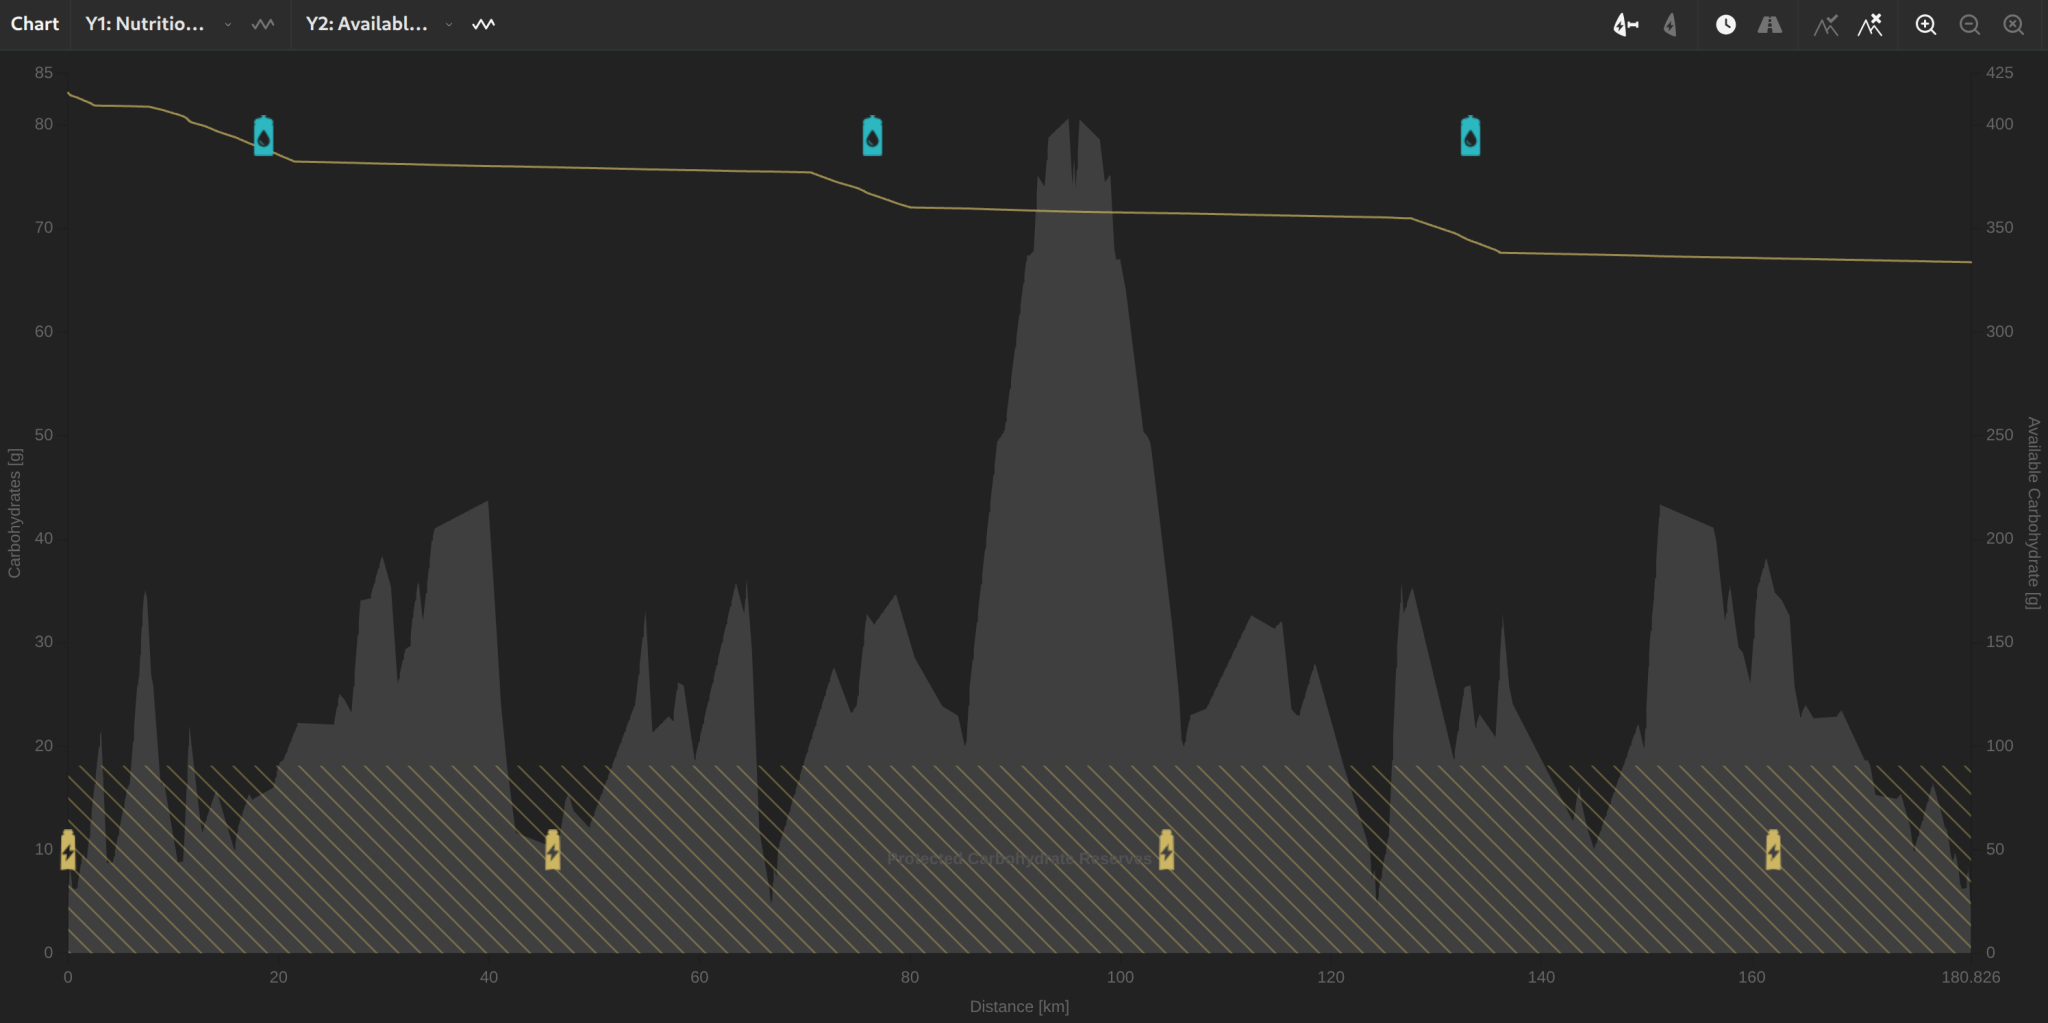
By importing your AI DIAGNOSTICS analysis, the carbohydrate demand is calculated individually: VO2max and VLamax determine the ratio of fat to carbohydrate metabolism at each intensity level. Without imported analysis data, the calculation relies on generic default values.
How well stocked your glycogen stores are at the start of the activity is set through the Carbohydrate-Availability field in the Nutrition sidebar tab. The choice should reflect your diet and training load over the preceding days:
- High: High availability, for instance after deliberate carbohydrate loading.
- Normal: Normal availability, as an everyday training diet provides.
- Low: Low availability, for instance after low-carb training.
This setting determines the endogenous carbohydrate store the simulation starts from.
For fine-tuning, the Carbohydrate Multiplier (in the Nutrition sidebar tab, under the advanced options) scales the modelled carbohydrate demand relative to the energy model: 100% leaves it unchanged, while lower or higher values (10–300%) scale the demand down or up. It lets you calibrate the plan against your own experience or assign different demands to Scenario A and B in comparison mode.
Carbohydrate Processing Model
The simulator does not treat ingested carbohydrate as a single pool — it tracks the carbohydrate budget along the course as a transit through three clearly separated pools:
- Unprocessed — already consumed but not yet absorbed in the gastrointestinal tract. Each intake first builds up this pool before being passed onward.
- Processed — absorbed and energetically available to the working muscle. This is the pool from which the metabolic demand is served first.
- Available (available carbohydrates) — the endogenous muscle and liver glycogen present at the start of the race, drawn on continuously through the ride; see Glycogen Stores and Carb Loading.
The flow between pools is governed by two mechanisms. First, each intake enters the unprocessed pool with an absorption delay. Second, unprocessed carbohydrate moves into the processed pool at a per-athlete ceiling — a constraint set by gastrointestinal transport capacity, in the range of tens of grams per hour. The metabolic demand draws from the processed pool first, and only dips into the available pool — the endogenous glycogen stores — once the processed pool is empty.
Two parameters of this model can be set directly in the Nutrition sidebar tab: the Maximum Processable Carbohydrate Intake (in g/h) is the gastrointestinal ceiling described above and governs how quickly consumed carbohydrates become energetically available to the muscle. The Maximum Carbohydrate Buffer (in g) caps how much unprocessed carbohydrate can be held in the gut at once before additional intake stops adding to that pool. The Maximum Carbohydrate Buffer appears once the advanced options are revealed, while the Maximum Processable Carbohydrate Intake is always visible.
When sustained demand outpaces the processing ceiling, the shortfall is met from the available pool and the planner highlights the affected segments. If that highlight coincides with a depleted W′ balance, that is a clear sign of an overly aggressive pacing-and-fueling strategy.
In the chart view, the absorption window is visualized so you can see when consumed carbohydrates actually become available as energy.
Caffeine Tracking
Every product in the database carries its caffeine content (in mg). The simulator tracks three quantities along the course:
- Caffeine load — the amount currently in the body. It rises with each intake and then gradually falls again.
- Cumulative dose — the total amount absorbed since the start of the race.
- Per-bodyweight dose (mg/kg) — the unit conventionally used in sports science to compare intake against published dose ranges.
These quantities serve as a planning aid — for example, to stay within commonly cited dose ranges. The simulator does not apply a performance multiplier from the caffeine load. The underlying pharmacokinetic formulation is described on the Physics and Methods page.
Fluid and Sodium Balance
The simulator carries two running balances along the course — one for fluid and one for sodium. Each is the cumulative intake minus the cumulative loss up to the current point in the course.
The sweat rate (typically 0–5 litres per hour) depends on body weight, exercise intensity, and ambient temperature. The water content of each consumed product is automatically added to fluid intake; likewise, each product's sodium content feeds into the sodium balance, which the simulator tracks along the course so you can watch for a developing deficit. A negative sodium balance can contribute to hyponatremia — a serious condition, particularly during long races with high fluid intake.
Two athlete-side values feed into these balances and are set in the Hydration sidebar tab: the Sweat Rate (l/h) and the Sodium Content in Sweat (g/l). Sodium content varies considerably between individuals — typical values roughly span 0.2–3.5 g/l — and together with the sweat rate determines the per-hour sodium loss.
In the hydration chart, two reference lines mark the fluid-deficit thresholds relative to your body weight: Mild Dehydration at 2% and Severe Dehydration at 5% of body weight. As the running fluid balance approaches or crosses these lines, you can see at a glance when your plan drifts into a range where performance and thermoregulation are typically compromised.
These two quantities are planning-side balance metrics. In the current model they do not feed back into power output: they show how your strategy looks on a hot race day, but they do not simulate a direct dehydration-driven performance penalty.
Pre-Depletion and Glycogen Management
You can account for the possibility that your glycogen stores may not be fully loaded before the race – for example, after an intense training session the day before. The Pre-Depletion of Carbohydrate Stores field (in g) in the Nutrition sidebar tab adjusts the starting conditions accordingly and lives under the advanced options.
Exporting Your Nutrition Plan
Once your nutrition strategy is set, you can generate a printable PDF nutrition plan. It lists all planned intake items with timing and product – ideal for attaching to your top tube for at-a-glance reference during the race.
Even More Precise with Imported Analysis Data
Nutrition planning becomes noticeably more accurate once you import your AI DIAGNOSTICS analysis. Imported physiology data allows the simulator to:
- Calculate carbohydrate demand individually based on your metabolism.
- Precisely model the ratio of fat to carbohydrate burning at every intensity.
- Realistically model the glycogen depletion curve.
Without imported data, the simulator uses generic default values – nutrition planning still works, but is less precisely tailored to your individual metabolism.