Performance Trends and Comparison
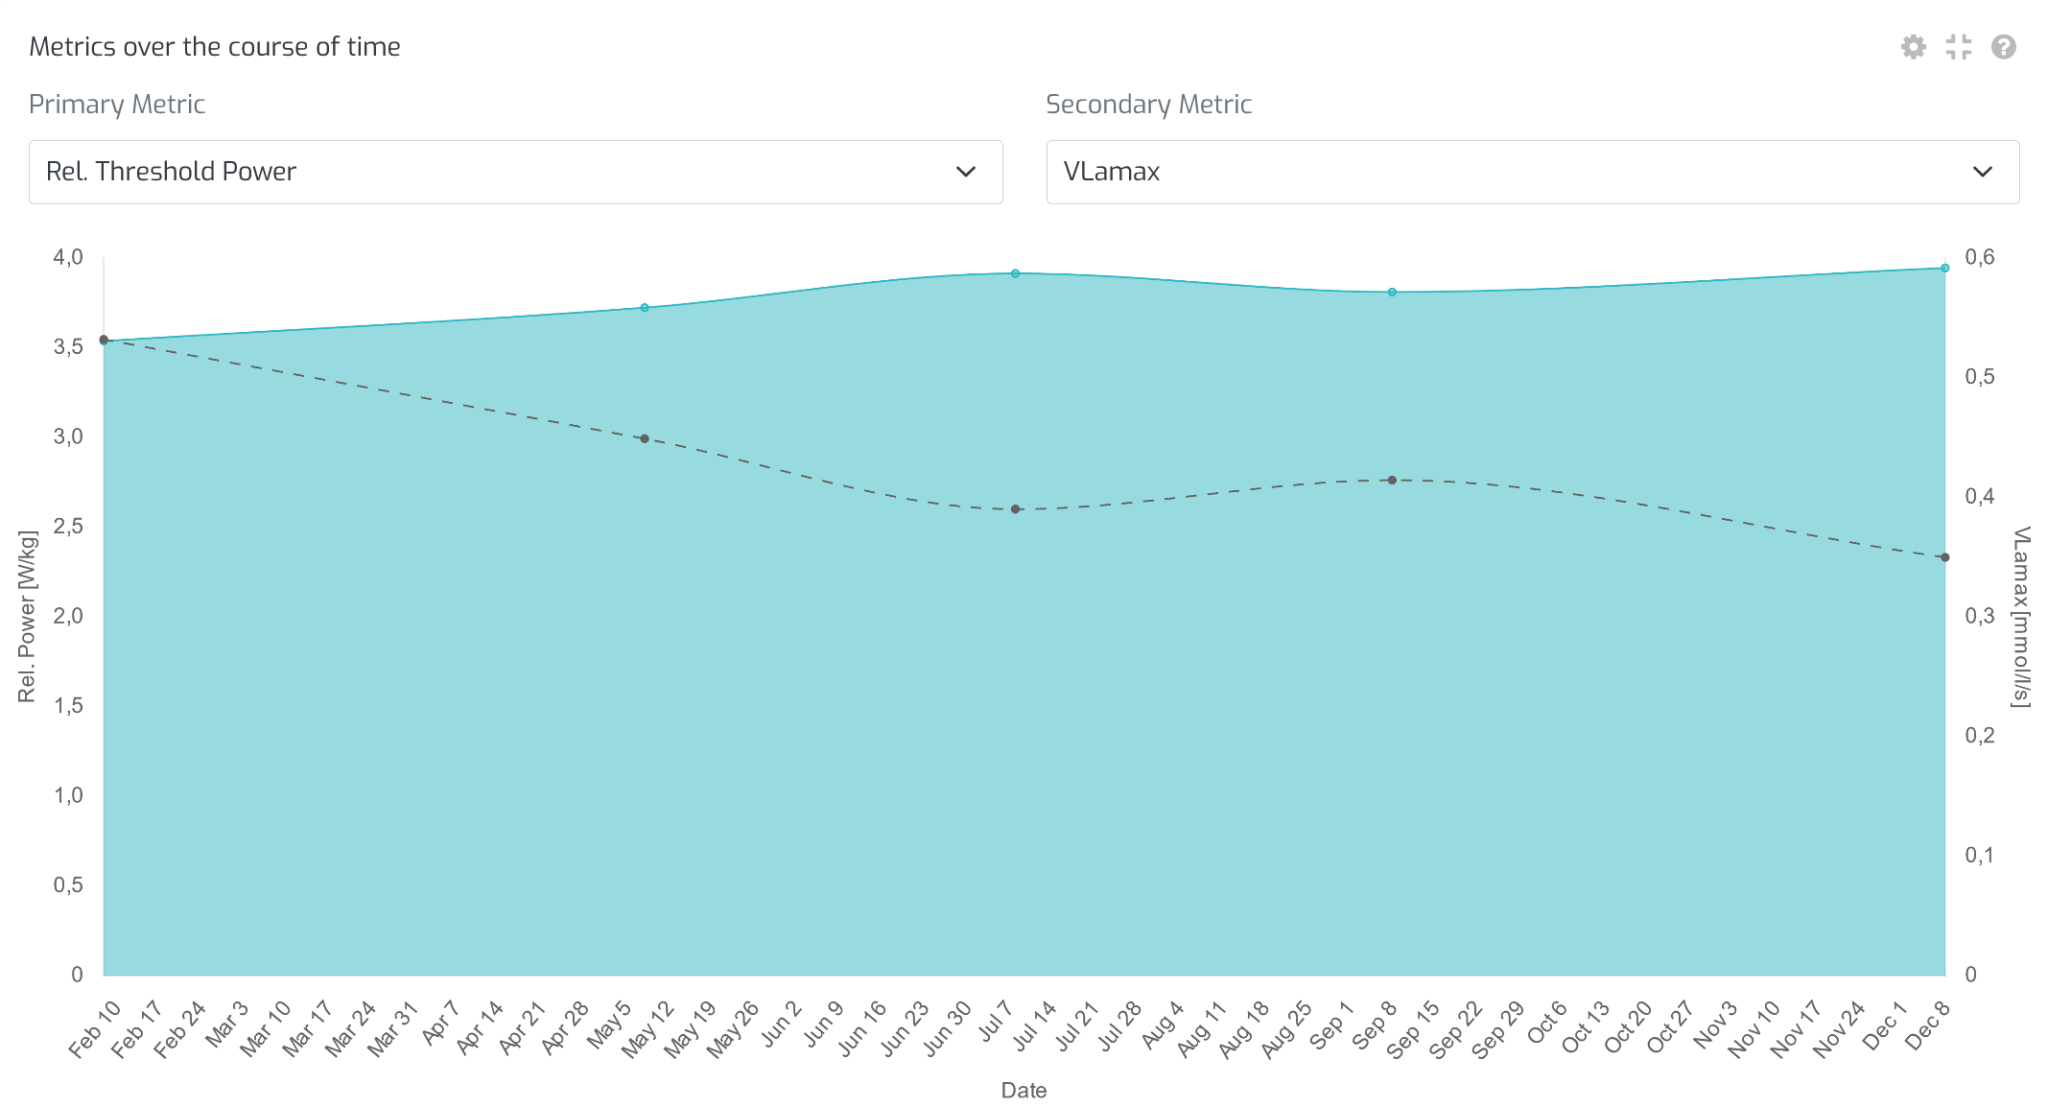
Your dashboard shows your performance development over time in a graph. Select the two metrics you want to display over time using the “settings” icon and analyze your performance development.
Comparison of Performance Analyses
Compare two performance analyses directly and gain important insights for your training program
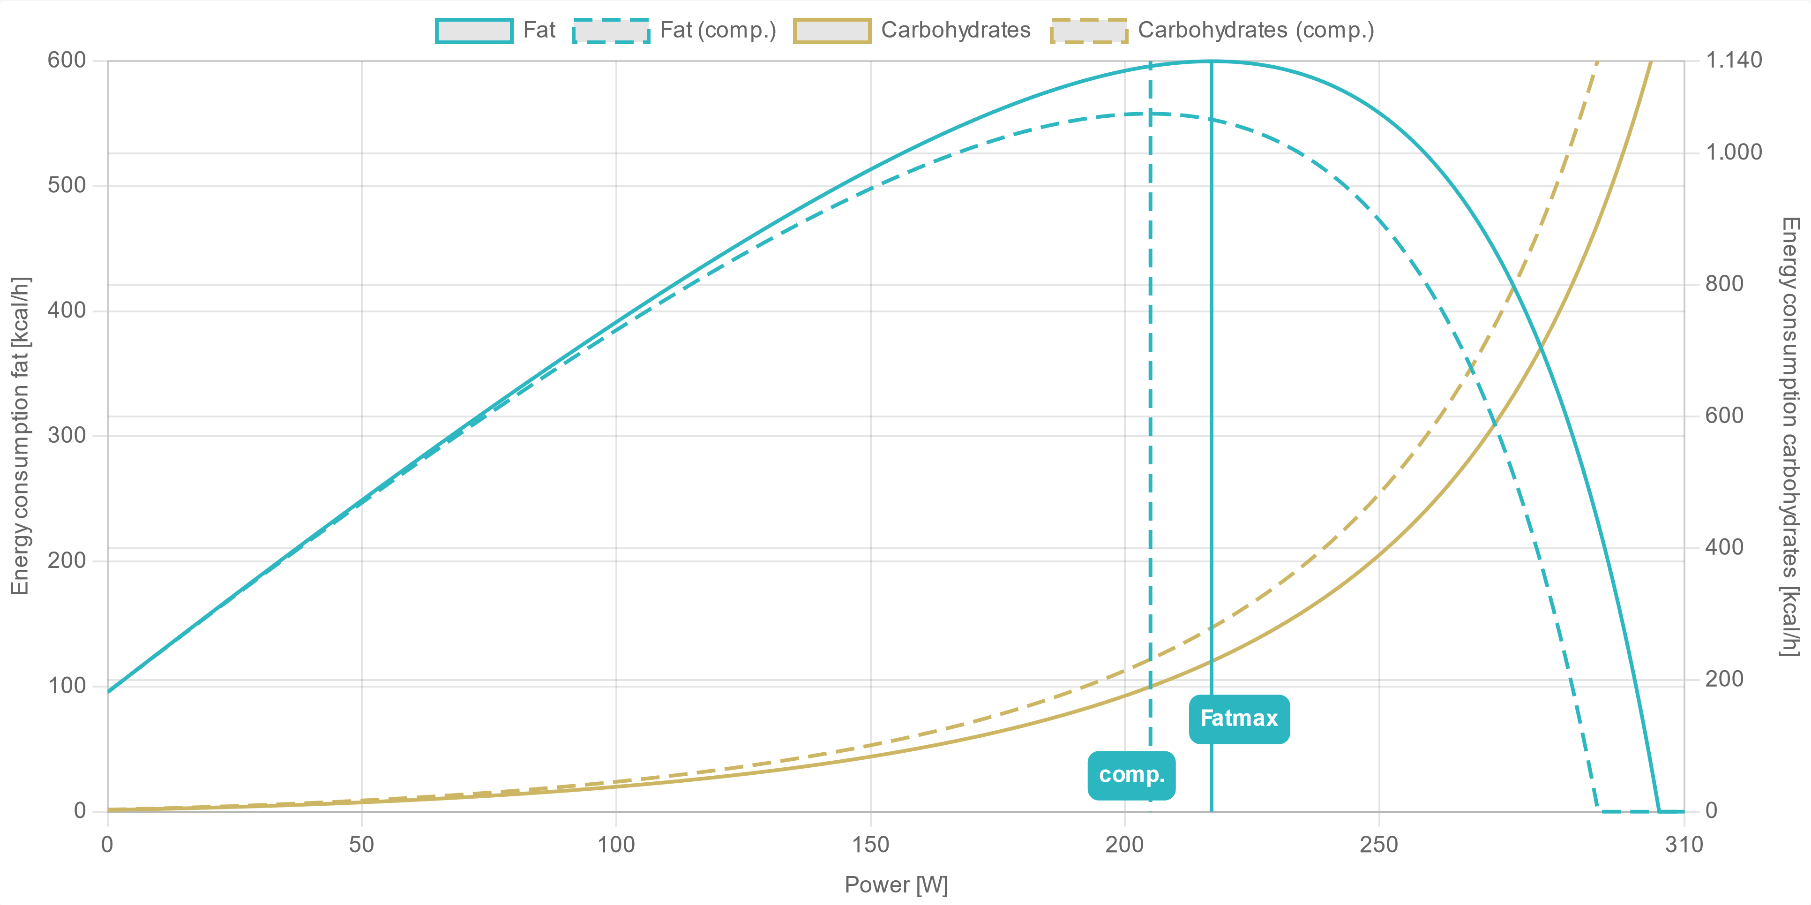
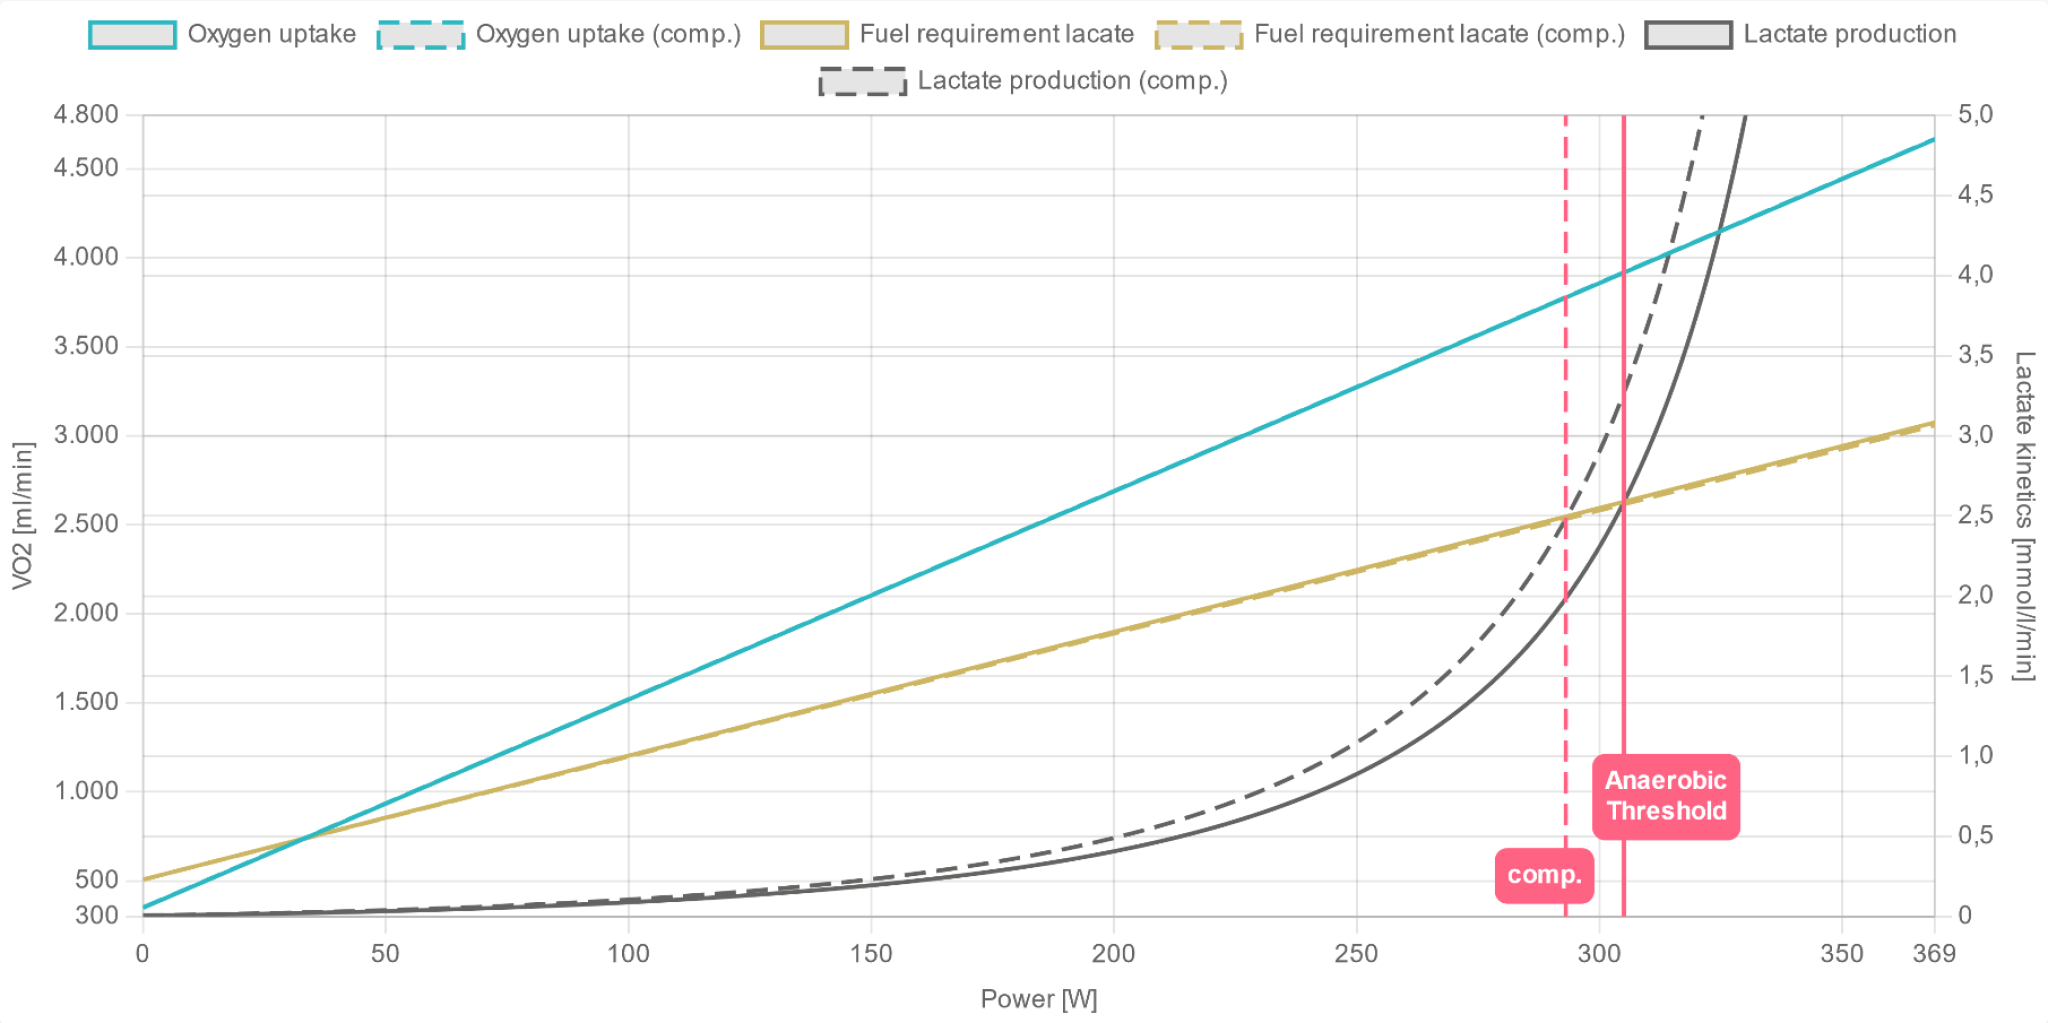
Open an analysis and select the "compare" icon. Once you have selected two analyses to compare, all improvements or deteriorations are shown in comparison. Use this function to evaluate your training and document your performance development.
The graphics for the metabolic model and energy consumption are also visualized in direct comparison. All improvements, for example in substrate utilization, are compared in detail via a mouse-over function.